

Point in time
We call our regular Apollo based commentary “The Weather report”. The analogies that we can make with the multiple elements of Value, Momentum and Uncertainty impacting markets in a continuous way chimes nicely with the idea of Currents, Tides and Winds, all impacting the navigation of the high seas. Whatever the nature of the vessel concerned or the skills, experience and capabilities of the crew, the Maritime Weather Report is an essential part of the information system that is required and so the Market Weather Report is designed to perform a similar, essential function.
Round the mark
Timing is everything. We have just passed the end of calendar Q3 and, for many investors, we are now very definitely in the run to the finish line for relative and absolute performance reporting for 2026. Q3 is now history and we start the last leg of the 2026 race. Simultaneously, the moment that the quarter ended, the information reporting calendar for the quarter kicked off (note that what was reported as Micron’s Q3 2026 results – released last week were actually for its fiscal Q4 – the 3-months to end August 2026). After what was widely regarded as a strongly outperforming Q2 for Corporate US (+23% yoy) – that itself followed on a series of accelerating profit growth – we are running into this reporting season with rising expectations and upgrades. It is also going to be a compressed information period: nearly half the S&P reports in the last week of October (what Citadel Securities refers to as the Superbowl of Q3 Earnings) with 2/3rds having reported by the end of the month. Whilst this is not a new phenomenon (SEC regulations typically require companies to file quarterly earnings (10-Q) within 45 days of the period end) there is no doubt that the tone and expectations for the rest of the year are well and truly set by the end of the month.
Beyond the headline numbers
Our nautical analogies have often extended to not only sailing but to yacht racing. The concept of relative performance over a series of Sprint races at a regatta (as opposed to one long race) was the analogy that I used back in April’s weather report when discussing the post rally reality. As we start October, we can look at what is providing the momentum into the start of the final leg of the race – what is going to provide the source of marginal demand , the set up for the critical relative performance boost for the year as a whole – in sailing terms what is going to provide speed into the Jibe mark ahead of the last leg of the race.
Coming on the back of an end quarter that saw de-leveraging and a cooling in US retail demand, it does appear as if markets have reset after the summer – ready for the quarter ahead. What was notable for many was how quarterly performance was, once again, a Mag-7 (and by extension an AI) story. Having started the quarter under pressure after the less than stellar SpaceX IPO in June, a 55% rally from its July 31 lows for SpaceX has been accompanied by record inflows into the Mag-7 related ETFs – arguably attracted by the existence of robust balance sheets with strong cash flows in the face of rising long term interest rates and stress in the credit markets. What will not be lost on readers is the potential conflict that will arise from this rotation, as AI infrastructure costs look set to absorb virtually all the free cashflow of the hyperscalers – and then some – as we go into 2027. What had been a marginal view in July – that the whole AI story was a bubble of wasted capital expenditure and IPO related hype – is now a mainstream talking point. Open AI’s decision not to try and IPO in 2026 (Anthropic is still hoping to) is forcing the whole VC/PE/IPO exit cycle into the spotlight and transparency is becoming associated with trust across the industry. Part of the concern over Q2 earnings is related to how the equity holdings in the big AI Labs have “contributed” to hyperscaler valuations and even if we are looking at higher reported revenues and earnings over the coming weeks, it will be the guidance for 2027 that will set the tone.
Externalities still matter – continuously
Beyond this, the perennial Macro concerns over energy prices, the Fed policy cycle, the US Mid Terms and ongoing geopolitical realities worldwide are leaving other markets (bonds, FX, and commodities) as potential disruptors to our “sailing tactics”. Unlike the schedule of the corporate reporting calendar that allows for this resetting of relative performance at a neat point in time (quarter end), these externalities are very much part of the “in race” conditions and are increasingly falling into the realms of what we might consider prediction markets, where the “probability is the price” and the changes in those probabilities are decidedly non-linear. Odds of an October US Fed rate hike have collapsed since the middle of September, but when snap elections are called in Spain or the streets of Paris are on fire, the impact on European Bonds and the Euro spike sharply higher. Macro is no longer long term and predictable – it is short term and noisy.
This combination of turbulent macro conditions and persistent relative valuation uncertainties is playing havoc with the risk books of the multi-strategy funds. US equities may be getting a lift from an increase in projected 2027 earnings, but should a deflation shock emerge – a collapse in Oil and commodity prices following a resolution in the Gulf/Ukraine – then the balance of returns could skew sharply in favour of debt markets into year end. Conversely, an escalation in events could prompt central bank tightening and a forced deleveraging of credit related risk as investment grade ratings come under pressure across the AI infrastructure markets. These are not event predictions – but the existence of prediction markets means that the what used to be markets by the point-in-time repricing related to the reality of an event occurring – a post-election rally for example – is being replaced by this continuous information arbitrage. We cannot simply set course for the finish line in early October and assume that the winds won’t change. A tailwind into year-end is no more certain than a headwind at this point. One gets the sense that skilful risk management is likely to prove the difference between the winners and the also-rans into year end.
Review of Performance – slowing into the turn
In taking our normal look at some of the recent performances of the main market indices through the lens of the Apollo strategy models (price performances are to index close values from 30 September 2026) we take the calendar quarterly update 3m% for Q3 and the YTD numbers as the baseline for review.
For context, the 6-month returns in Table 1 take us back to the end of Q1 – the effective lows for the year for the major indices, whilst the 3-month number taking us back to the end of June. The one-month numbers give sight to how markets have struggled to sustain the rally seen to mid-August.
Table 1: Performance Report (price returns %)
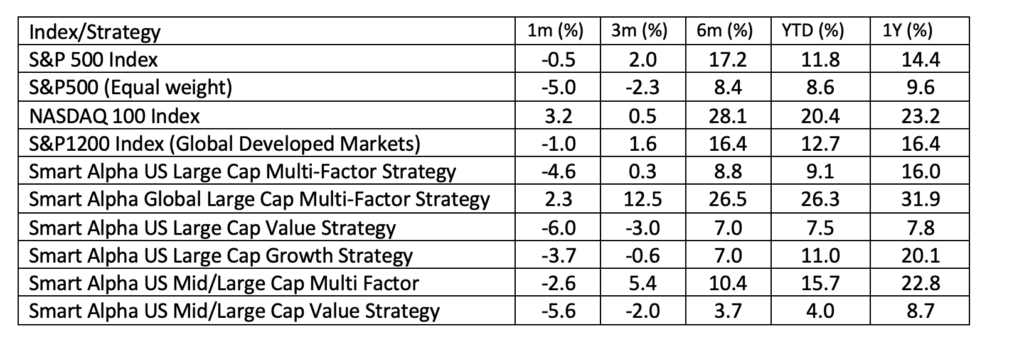
Both the one-month and three-month story is dominated by the sell-off in Bond markets and the ongoing narrative around AI. As the strong one-month Nasdaq 100 return shows, the shift in risk appetite for Tech and AI related investment has remained volatile: note that both the market cap weighted S&P500 and the S&P1200 under-performed in September despite the Mag-7 recovery (+11%) over the quarter as a whole, but the equal weight was down heavily (-5%) on the month, (-2.3%) for the quarter as record ETF flows ($1.9trn YTD according to Citadel Securities) appear to be driving into more cap-weighted products. The end result has been to leave the quarterly returns more “modest” – the S&P500 being up 2% over the quarter in price terms is in line with an annualised return closer to 8.25% than the annualised 13.5% of the last decade.
After nine months, the YTD performances for both the global S&P1200 index and the Main S&P500 US index are only slightly behind the same time last year (the equal weight S&P500 is essentially identical at 8.7%) but with the Q3 reporting season ahead, the tone for equities does appear to remain relatively sanguine despite the usual macro headlines.
Alongside the benchmarks we can see the selection of Smart Alpha – that we run (and publish – see https://www.libra-is.com/strategies ) reflected here. On the one-month, six-month and YTD basis, the US Smart Alpha Multi-Factor strategy is looking far more aligned with the equal weight S&P500 index than the market Cap weighted index. Arguably this reflects the Mag-7 factor highlighted above. By contrast, the Global Multi-Factor is showing a nearly 14% outperformance over the S&P 1200 benchmark on a YTD basis ((+26.3%) vs (+12.7%)). The positive impact from a rotation into mid-caps is also evident from the performance of the US Mid/large Cap multi strategy (+5.4%) which is now (+15.7%) YTD and a significant outperformer over all other US related strategies on the system.
From a style perspective the Growth/Value trade-off can be seen in the data for the various US Value and Growth strategies that we run and where, having caught up with Growth over recent months, Value has resumed its August slide to leave the Value sleeve down 6% on the month and 3% over the quarter. We can generate these distinct single-style strategies by virtue of the fact that we categorise all the stocks under coverage by “style factor” based upon our own, fundamentally derived classifications (Value, Growth, Quality, Junk etc.) using the Apollo model for expected returns. This allows us to dive a little further into the drivers of returns.
Risk (and returns) by Factor
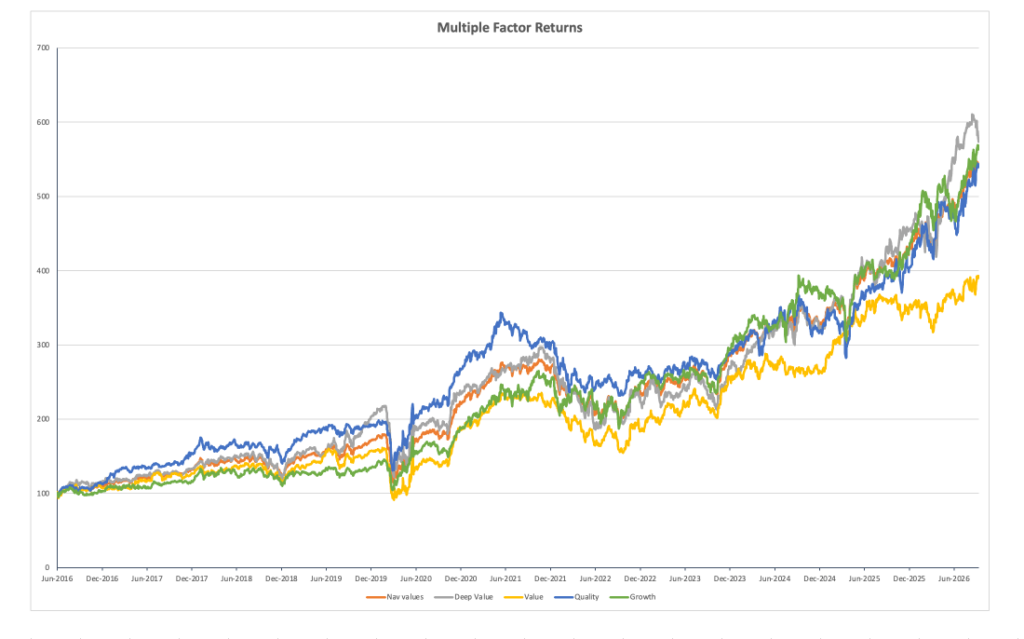
In terms of the factor drivers that we can see within a strategy (Table 2) the differentiated drivers of the Global Multi–factor portfolio from the sub-portfolios YTD has seen exceptionally strong Q3 from Quality (+21%) over the quarter,(+33% YTD), and also from Growth (+20%) in Q3 (+29.5%) YTD) as earlier declines reversed with a vengeance. Value did some catching up in July (+6%) and continued into quarter end (+10%), although on a YTD basis (+12.9%), still lags in relative terms. Deep Value had a poor Q3 by contrast (+2.1%) but remains (+27%) YTD. As always, these Factor returns reflect our bespoke factor categories and stock selections – combined with the two-month rebalance that we undertake. Our last Rebalance was in mid-August and the performances of this latest sprint are also shown in the table.
Table 2: Global Factors

Chart 1 shows the longer-term trends of factor returns to illustrate these relative returns. Deep value (grey line) stands out at the top of the chart despite the recent retracement, with Quality – the dominant (blue line) from 2016 onwards remaining aligned with both the total portfolio (orange) and clearly ahead of value (yellow) over the total period. Growth is a clear, compounding winner over longer horizons and as noted above, one of the dominating factors of late. Meanwhile, the relative under-performance of Value remains only too visible on the chart, perhaps suggesting that value stocks remain more of a risk management than a total return role in portfolios at present.
Chart 1: Compounding returns
Weather Forecast – Autumn is upon us
A lot of the activity in the 4th quarter is going to be about calm heads and risk management of conditions. Holding onto performance thus far is obviously a major focus for active managers and it would seem that a fair degree of positioning has taken place to achieve this over the course of the last few weeks. The immediate focus of navigating through the Q3 reporting season will probably increase volatility around individual stock names but will also involve a far more considered focus on guidance: Q3 earnings are typically the point in the year when the first, proper conversations are had about plans for the year ahead. What this means is that by the end of the month – and arguably before the US Mid-terms at the start of November – US equity markets will have a conditional view of 2027’s prospects. At that point the politics will kick back in and it will be back to the Macro prediction markets to set the tone for the rest of the year.
Chart 2: The S&P bellwether
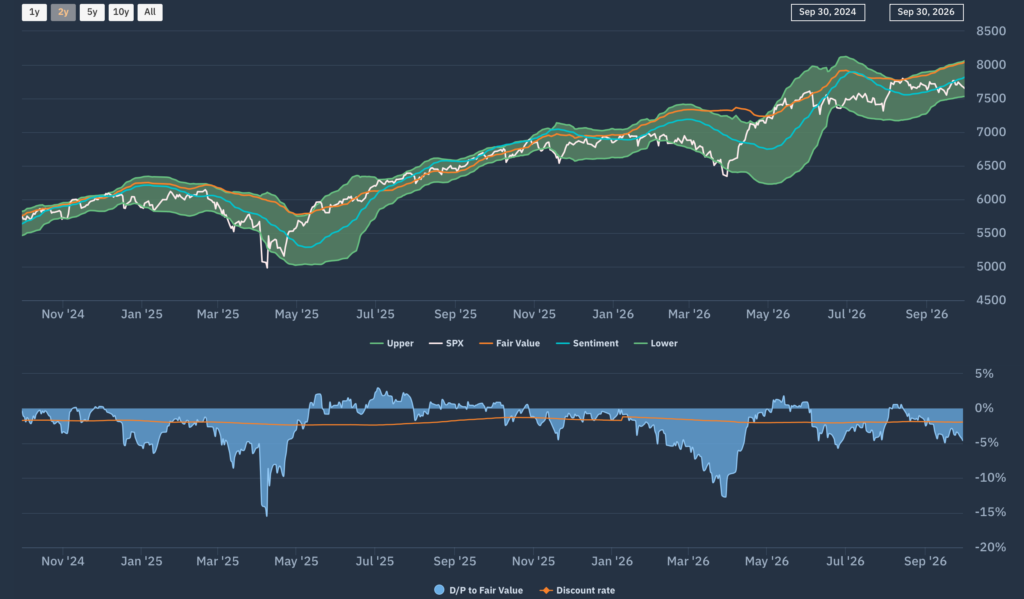
If we take a look at the Apollo market chart for the (market Cap weighted) S&P500 shown in chart 2, we can see how the index level – having rallied from a relative low at the end of July to test the top of the FV range (and the FV level itself) by mid-August, settled into the upper (positively trending) FV range until it broke down into the (still positively trending) lower channel on September 9th. A test/retreat of this range boundary 10-days later would suggest the market “sense” remained more cautious into quarter end.
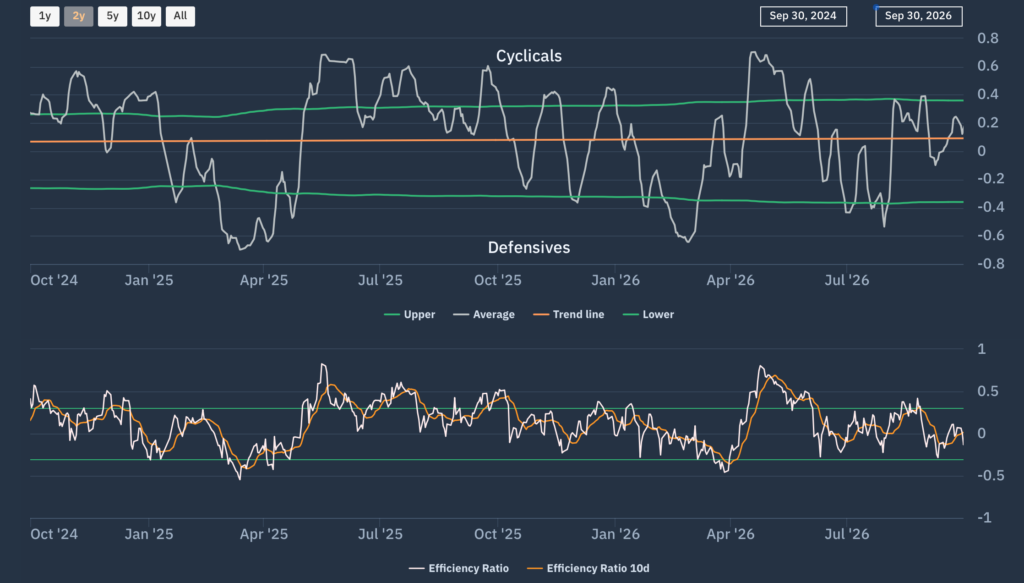
Moving down a level, we can look at whether there are any sector level dynamics now emerging that can be used to read across to other markets and Chart 3 is the Apollo Heat Map that we use to do this. This beta heatmap for the S&P500 shows the relative sector rankings in terms of rolling 1-month returns across the main US S&P500 market sectors, ranked by relative market beta from high beta (cyclical sectors) down to low Beta (defensive sectors).
We can see how energy remained a standout performer over the last month but that as we noted last month, starting mid- August, the Tech sector and sectors picked up the lead. A brief rally for consumer discretionary stocks dropped away by late August to be replaced by the still (relatively) high beta Communication Services sector as Mag 7 stocks Meta and Alphabet drove the sector higher into quarter end Our “Macro indicator” shown here on our Net beta chart (Chart 4) captures this shift back towards higher beta (greater risk appetite) and confirms the rotation that we had anticipated back towards Tech in July’s report and again last month has continued to be the dominant driver for the US market over the course of the quarter.
Chart 3: Apollo S&P500 Sector Heatmap
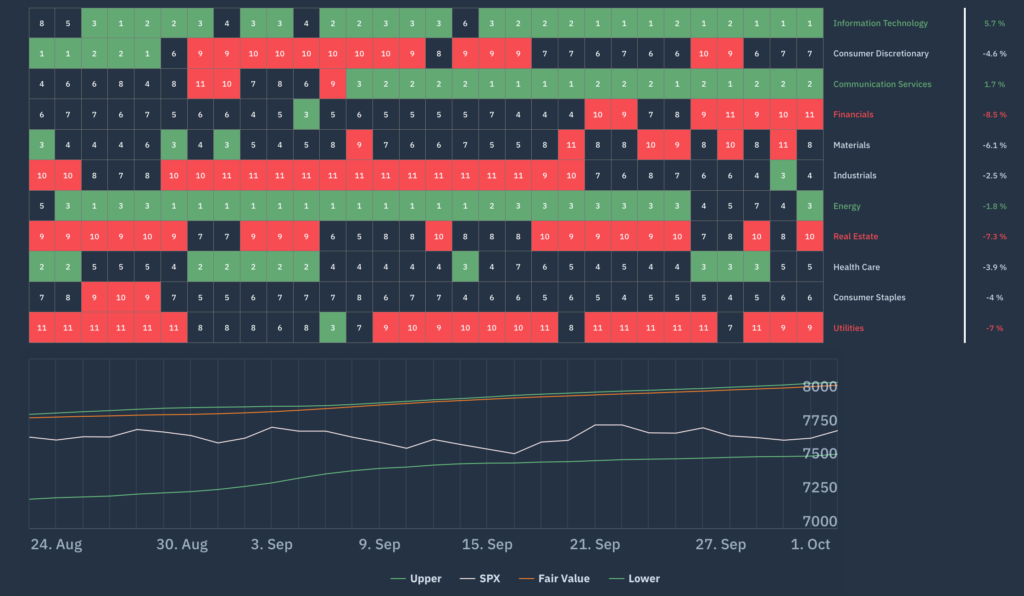
Chart 4: Apollo S&P500 Net Beta Chart
Forecasts and conclusions – time for a reality check
Given the dominance of the US financial markets, it is perhaps not surprising that much of the commentaries such as this one are given over to discussing investment through that lens. However, as we discussed last month, one of the primary reasons that we have for focusing in on the global benchmark (S&P1200) and the risk factor breakdowns that we can derive from it is because there is a clear means by which this particular regional risk factor can be managed whilst simultaneously examining the “stylistic” factor drivers of Value, quality, Growth etc. unconstrained by geographical/ regional boundaries.
This is not an argument for diversification by region. As I have noted in the past, the integration of Asian markets such as Korea, Japan and Taiwan into the global supply chains of the Technology and innovation related sectors means that thematic investment styles have already shifted onto a global – not a regional – framework. Post 2022, Commodity, Energy and Defence related themes (increasingly being expressed via the Active ETF markets) have also taken on a global dimension. Localised themes obviously do persist – “US Reshoring” or “German Defence Manufacturing” for example – but as the multiple drivers of equity returns become more “packaged” in terms of not only the growth opportunities promised (effectively all thematic ETFs are growth plays) but of their correlated broader market risks, the country or even sector risk considerations do not play the same kind of role in terms of risk management that they once did.
Governments in Europe or the US may try and regulate and penalise their international competition to protect home grown companies, but the limits on both physical and intellectual capital controls have shifted beyond regional boundaries and to one of global competition. As the German auto industry has found out, the global EV market now belongs to the Chinese and as the rest of Europe is discovering, manufacturing anything without access to cheap energy is economically unviable. Meanwhile the limits of “AI growth” are coming up against the cost and complexity of building AI datacentres in places where power and cooling remain critical considerations; putting growth at risk. This is how we got to SpaceX, datacentres in space and nuclear energy plants on the moon. Such intangibility in terms of future returns may have survived during a period of cheap energy, cheap capital and essentially free IP (all the frontier models basically trained on the Web for free) but the guidance and scrutiny for 2027 prospects that (should) come with this reporting season will set the tone for all of these growth drivers going forward.