

Reality “Bights”
We call our regular Apollo based commentary “The Weather report”. The analogies that we can make with the multiple elements of Value, Momentum and Uncertainty impacting markets in a continuous way chimes nicely with the idea of Currents, Tides and Winds, all impacting the navigation of the high seas. Whatever the nature of the vessel concerned or the skills, experience and capabilities of the crew, the Maritime Weather Report is an essential part of the information system that is required and so the Market Weather Report is designed to perform a similar, essential function.
July has come to an end and, as we move into August, a dose of reality has arrived with it. In fact, as the title of this month’s weather report attests, reality hasn’t just arrived – “Reality Bights”. The play on words and spelling of the word “Bight” (as opposed to bite) is deliberate – not only because of the aforementioned maritime theme of our weather report in the form of a referenced noun, but that the transitive verb also applies.
According to the Collins Dictionary:
Bight
noun
1: a wide indentation of a shoreline, or the body of water bounded by such a curve
2. the slack middle part of an extended rope
3. a curve or loop in a rope
Verb
4. (transitive) to fasten or bind with a bight
When I introduced Kelvin waves into this maritime-themed framework last month, one of the differentiators of Kelvin waves that I focused on was their persistent driving of deep-water layers along coastal boundaries. The capacity of these “planetary waves” to swell and drive the waters along the shoreline provided the analogy with the macro forces that markets are often faced with. Geopolitics, interest rates, FX, commodities and energy all interact with markets but, as with our maritime situation, it is only when sailing along the coastline that the impacts are felt persistently.
So, in this instance our “bight” is the market curve now appearing ahead. Constrained by a “coastline” of hard financial and economic reality but still driven by macro forces, the market and macro events of the last month all fit into a new – potentially more realistic, awareness regime. For US markets in general and the Tech sector in particular, reality certainly landed hard with the fallout from June’s SpaceX IPO. A postponement of a potential Open AI IPO and the arrival of an earnings-season now laser-focused upon the capital costs of AI-related investment has led to a deflation if not the collapse of the AI hype bubble. Meanwhile, the liquidation of the Situational Awareness fund has sobered up those who were taken in by the parallel social media hype around “genius in AI” being all you need to succeed in markets. Throw in a change of management team at the Fed and the macro realities of the Strait of Hormuz and the Red Sea being effectively closed whilst the Middle Eastern MOU collapsed and then is starting(?) to be resurrected, and the constant drumbeat of Ukrainian success being met by the reality of Kiev being left effectively defenceless against Russian missiles – and markets are beginning to wake up to their own reality.
Simply put – the persistent hype over future success or opportunity that has so dominated both the market and geopolitical narratives of the last eighteen months has collapsed. The explosion of prediction markets and high-profile social media posts are just a rehash of the WallStreetBets phenomenon of 2021 where “all you needed to be” was on the right side of the “meme” – until you were all on the wrong side. On this basis one can argue that the marketed opportunity to get (at a price) a “premium feed” on Truth Social posts from the White House may have just marked the end of this particular redux. As we begin August, the idea that money could simply be made by being on the right side of a tweet, a posting on TikTok, an “insider insight” via a prediction market price jump or access to a new AI related IPO has been cast aside alongside “hydration breaks” and half time shows.
Macro Realties
It is now clear that there will be no quick wins from surging tariff revenues, no quick end to wars and, for every positive development announced in the world of AI, there is an almost immediate counterpoint. We are now being held by that very “bight” of (previously loose) rope that has driven markets since 2024. Tech still dominates in terms of growth potential but then its capital demands (and their costs) are now rising to the point that returns to growth are being rightly questioned. Public US intervention in the Japanese Yen has occurred for the first time in 30 years – raising concerns over the stability of global growth. Meanwhile, the surplus of oil reserves that we entered 2024 with has disappeared and the idea of cheap energy has gone with it. Across the globe, inflationary costs are binding the hands of central bankers in terms of interest rates whilst western governments seek to drive fiscal and industrial policy towards the nihilism of ever increased defence expenditure whereby costly and valuable resources are realigned towards destructive as opposed to productive outputs.
These then are the realities that form our macro coastline for the rest of 2026. Back in April we referenced the idea of being in a sailing race and it is worth revisiting that concept here:
“…if we extend our nautical analogy here, we are in a sailing race. The strategy is to win (of course) given the prevailing conditions, but the tactical awareness of how to manage the conditions during the course of the race is key. All the boats in the race start from the same point and enter the initial phase together, jockeying for position, seeking to gain “lift” from the freshening winds and watching out for the pressure ridges that form on the water ahead as the guidelines for where to run. Everyone operates at full pace, with those tacticians best able to read the shifting patterns of wind, tide and current moving ahead.”
The start of August brings with it the arrival of the Cowes Week Regatta – its 200th anniversary year. Even though Cowes features relatively long form one race a day racing (as opposed to 3 or 4 races in a single day) there is a world of difference between a four hour Regatta race and a multi-day offshore one. In April we were thinking in terms of the latter – now we should be thinking more along the lines of a one day Regatta race as our metaphor. The image at the top is of the harbour at Helgoland (references to the name of my SubStack are not entirely coincidental) that acts as an entry point into the Helgoland Bight that leads up to the mouth of the Elbe (there is no bight on the English Southcoast so I couldn’t torture the Cowes analogy any further). The point about coastal sailing is that that hard land barrier is always there and conditions are always going to be affected by that reality. Strategy gives way to tactics and both the physical reality and the different nature of close to shore conditions are essential to consider. One doesn’t want to get caught in coastal dead zones or get too close to capes and headlands. Staying the course in more predictable, deep-water tides and avoiding the swells that might push you onshore are essential steps to take.
Last year, the investment markets in August offered steady, reliable conditions as the rebound from tariff fears unwound. This August we see the opposite. We are not dealing with the possibilities of the future so much as the consequences of the recent past. What might look like a relatively calm July (the S&P 500 was essentially unchanged on the month) hides far more below the surface than we might care to acknowledge. It’s to a review of those elements that we now turn.
Review of Performance – beneath the waves
In taking our normal look at some of the recent performances of the main market indices through the lens of the Apollo strategy models (price performances are to index close values from 31 July 2026) we continue to build upon our thoughts over the last few months and move on from the thoughts about returns over the first half to focus in on the YTD numbers.
The 6-month returns in Table 1 take us back to the end of January whilst the 3-month number taking us back to the end of April. The one-month numbers give sight to how well (or badly) H2 has begun.
Table 1: Performance Report (price returns %)
| Index/Strategy | 1m (%) | 3m (%) | 6m (%) | YTD (%) | 1Y (%) |
| S&P 500 Index | -0.1 | 3.9 | 7.4 | 9.4 | 18.1 |
| S&P500 (Equal weight) | -0.1 | 5.7 | 8.3 | 11.4 | 16.9 |
| NASDAQ 100 Index | -6.6 | 3.0 | 9.9 | 12.0 | 21.8 |
| S&P1200 Index (Global Developed Markets) | 0.2 | 4.4 | 7.8 | 11.1 | 21.8 |
| Smart Alpha US Large Cap Multi-Factor Strategy | 2.6 | 2.8 | 7.8 | 11.5 | 24.6 |
| Smart Alpha Global Large Cap Multi-Factor Strategy | 7.3 | 9.0 | 15.7 | 20.4 | 33.2 |
| Smart Alpha US Large Cap Value Strategy | 1.6 | 5.1 | 8.5 | 12.5 | 16.8 |
| Smart Alpha US Large Cap Growth Strategy | 1.26 | -1.3 | 5.2 | 13.1 | 28.1 |
| Smart Alpha US Mid/Large Cap Multi Factor | 6.8 | 7.6 | 12.3 | 17.4 | 30.4 |
| Smart Alpha US Mid/Large Cap Value Strategy | 3.1 | 3.5 | 7.5 | 9.4 | 19.4 |
The one-month story (the story of H2 so far) is dominated by one thing – Tech. As the Nasdaq 100 return shows, the shift in risk appetite for Tech and AI related investment has been brutal. Note that both the market cap weighted and equal weighted S&P500 were essentially flat over the period – a (+2.5%) equal weight performance of the Mag 7 will have helped to offset things here to a degree – but a major rotation out of Mega Caps and profit taking in Tech hardware names will certainly shape things over the rest of the year.
Much has been made of the move of the equal weight vs Market Cap up past that of the market cap weighted S&P500 YTD but the reality – (+9.4%) vs (+11.4%) and with the NASDAQ 100 (+12%) the Global 1200 (+11%) and the Russell 1000 (+9%) doesn’t really suggest an ongoing theme here.
As with individual stocks, the better datapoint to monitor is the relative performance compared to the YTD figure. By way of example – the S&P500’s biggest loser for July was Sandisk – down 47% on the month – yet it remains up over 340% YTD. Meanwhile, the positive performance of the Mag 7 equal weight in the month compares to the reality of the Mag 7 (equal weight) being flat YTD.
For investors, neither of these relative performances suggests an obvious “new trade” to consider, but then with the majority of realised market returns bunched around the benchmark (flat in July), Hedge Funds and Active managers are anxious to find additional alpha to try and get a good start to the rest of the year. As ever, we would note that any attempt to force excess returns comes with higher risk – especially now in terms of higher beta names.
Alongside the benchmarks we can see the selection of Smart Alpha – that we run (and publish – see https://www.libra-is.com/strategies ) reflected here. On both the one-month and the YTD basis, there remains clear water between the Smart Alpha Multi-Factor strategies and their respective benchmarks. The positive impact from a rotation into mid-caps is clear from the performance of the US Mid/large Cap multi strategy (+6.8%) which is now (+17.4%) YTD and a significant outperformer over all other US related strategies on the system. The standout, however, is the Global Developed markets strategy which has not only had a strong July (+ 7.3%) as a June rotation into Energy stocks paid dividends but is now over (+20%) YTD (and +33% over the past year).
From a style perspective the Growth/Value trade-off can be seen in the data for the various US Value and Growth strategies that we run where we see Value having largely caught up with Growth over recent months as the style impact normalises. We are able to generate these distinct single-style strategies by virtue of the fact that we categorise all the stocks under coverage by “style factor” based upon our own, fundamentally derived classifications (Value, Growth, Quality, Junk etc.) using the Apollo model for expected returns. This allows us to dive a little further into the drivers of returns.
Risk (and returns) by Factor
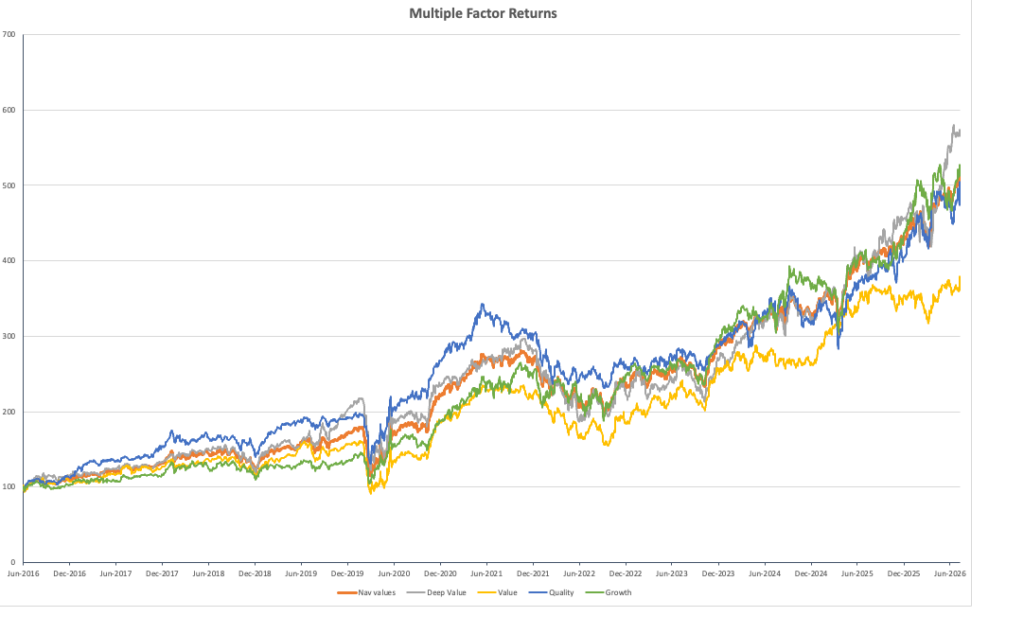
In terms of the factor drivers that we can see within a strategy (Table 2) the differentiated drivers of the Global Multi–factor portfolio from the sub-portfolios YTD has seen a strong Q2 from Deep Value (+26% YTD), and an even stronger (double digit) start to Q3 from both Quality (+11% in July, +24%YTD) and Growth (+12% in July,+20%YTD) as June declines reversed. Value did some catching up in July (+6%) but on a YTD basis (+9%), still lags heavily in relative terms. As always, these Factor returns reflect our bespoke factor categories and stock selections – combined with the two-month rebalance that we undertake. Our last Rebalance was in mid-June and the performances of this latest sprint are also shown in the table.
Table 2: Global Factors

Chart 1 shows the longer-term trends of factor returns and illustrates this point further. Deep value (grey line) stands out at the top of the chart with Quality – the dominant (blue line) from 2016 onwards remaining aligned with both the total portfolio (orange) and clearly ahead of value (yellow) over the total period. Growth is a clear, compounding winner over longer horizons and as noted above, one of the dominating factors of late. Meanwhile, the relative under-performance of Value remains only too visible on the chart, perhaps suggesting that value stocks are performing more of a risk management than a total return role in portfolios at present.
Chart 1: Compounding returns
Weather Forecast – every day is race day
What the performance of the market has shown since early June is that no one believes in the past continuing unabated – but at the same time, no obvious and clear future is visible. A steady stream of questioning geopolitical counter-narratives about the situation in the Middle East, Ukraine, China and Venezuela are combining with the market realities of a sharp drop in the price of gold, US bond yields moving to a 19-year high, a rollercoaster in oil prices and US Treasury intervention in the Yen FX market. As ever, macro is coming into market pricing directly in the form of the impact on these prices, but from a second order perspective it is also beginning to make a longer term impact on liquid markets such as equities.
The realisation that the maturing AI investment story is not only vulnerable to external risks such as the Chinese open-source model threat from the likes of Kimi K3 but from the hard macro realities of corporate free cash flow pressures, deteriorating credit ratings, margin financing demands and market liquidity is a genie now firmly out of the bottle. No amount of wishful thinking is going to reverse that reality, and the capacity to achieve outsized, leveraged returns from financial markets in order to support capital expansion projects with no visibility of return no longer seems to be in anyone’s future view. Instead, the market is looking for rewarding realities – not ambitions.
To return to our nautical theme, if you want to win at Cowes this week, even though you do not need to win all seven races, the “low-point-goal” scoring process of the Regatta means that survival and steady performances are what matters most. Although “every day is race day” the cumulative effect starts to impact on expectations way before the end of the week. By the middle of the week, expecting to be able to miraculously change relative rankings is a pipe dream and the decision to survive, to consolidate on whatever has been achieved in the first half and to do your best to be as good as you were able to be in the first few races doubles down on process, repeatability and consistency. As with sailing, so with markets. Outsize losses in April or winners in May provide little confidence for the rest of 2026. Positioning, risk management, and a coherent investment strategy will give lie to the old throwaway line of “…better to be lucky than good”.
Chart 2: The S&P bellwether
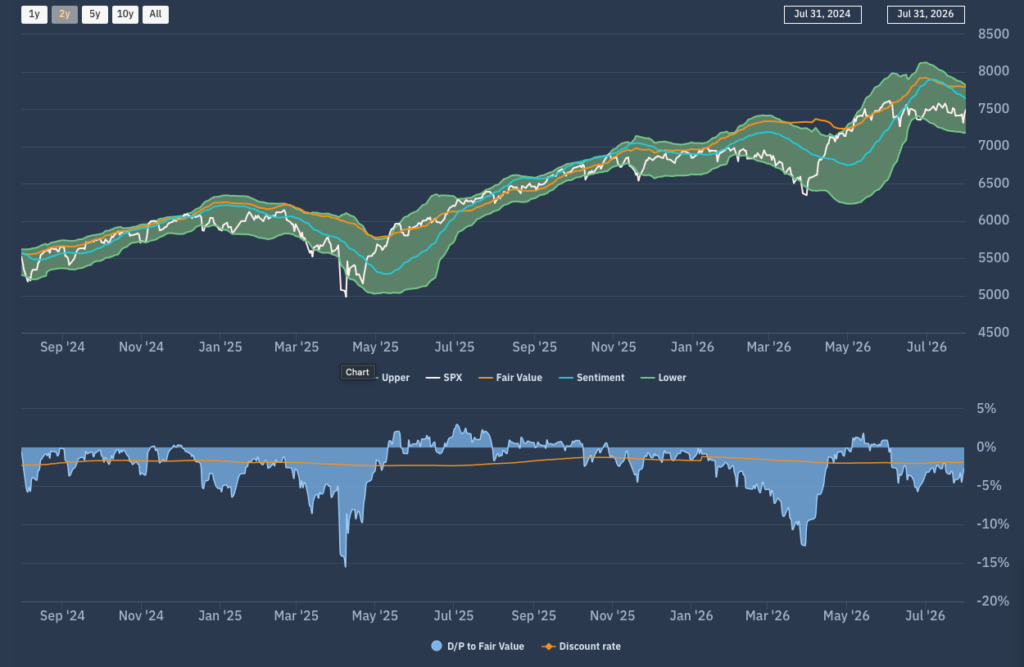
If we take a look at the Apollo market chart for the (market Cap weighted) S&P500 shown in chart 2, the “fair wind” rally into mid-year that we had been looking for at the end of April hit a roadblock in early June. Strong US economic data and possible rate hikes were cited at the time as reasons to be “fearful” whilst there is a clear possibility of decks being cleared ahead of the SpaceX IPO (or the World Cup?). Whatever the cause, from there on in, the major US market has traded sideways and down – retracing from the top of the FV range optimism of early May via an end of quarter break of the lower bound in late June, and ending up with the flat performance of July. Since that break-down in June the index has remained in the lower channel from a sentiment perspective – with that channel starting to roll over in early July before clearly trending lower.
Moving down a level, we can look at whether there are any sector level dynamics now emerging that can be used to read across to other markets and Chart 3 is the Apollo chart that we use to do so. This is the Apollo beta heatmap for the S&P500 that shows the relative sector rankings in terms of rolling 1-month returns across the main US S&P500 market sectors, ranked by relative market beta from high beta (cyclical sectors) down to low Beta (defensive sectors).
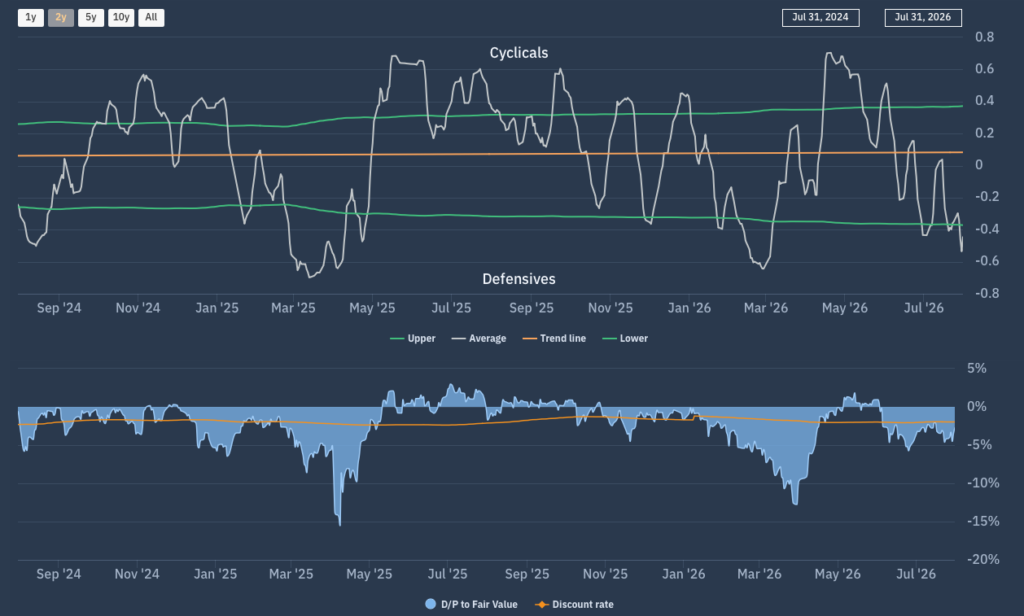
We can observe a continuing decline in the higher beta sectors with ongoing negative performances across the higher beta cyclicals versus a universally positive swing towards defensives. Our “Macro indicator” shown here on our Net beta chart (Chart 4) highlights the similarity to mid-June on a net beta bias where we can observe the net exposure bias between defensives and cyclicals shifting to an extreme. To the extent that risk appetite can improve from here, a degree of rotation back towards Tech would be the most likely outcome as portfolios become more widely balanced for the remainder of the summer.
Chart 3: Apollo S&P500 Sector Heatmap
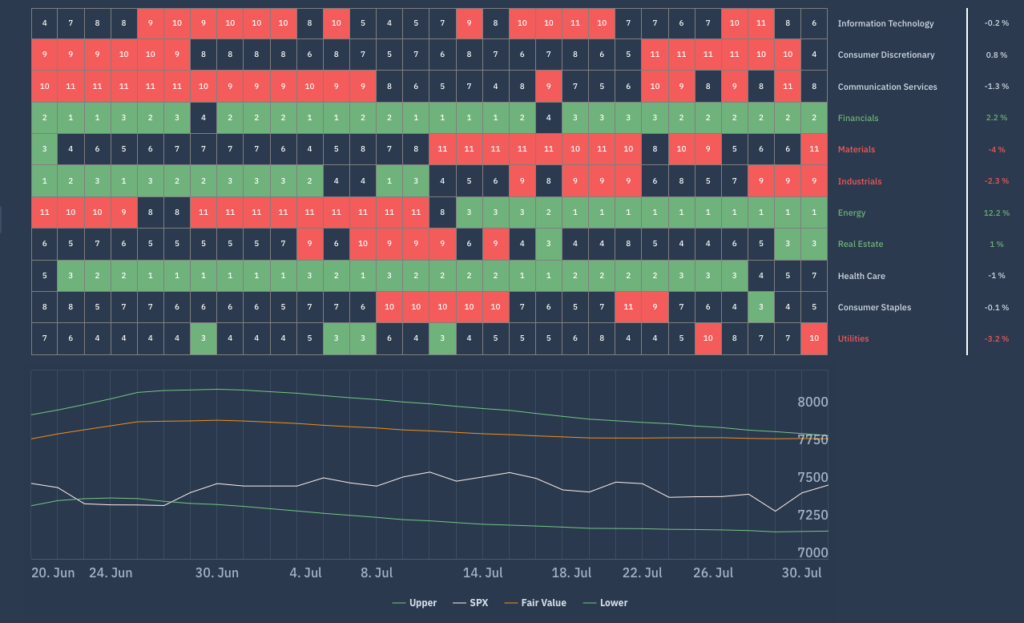
Chart 4: Apollo S&P500 Net Beta Chart
Forecasts and conclusions
What’s done is done. In the same way that in the wake of a (temporarily?) severe shortage in memory capacity, SK Hynix or Sandisk were able to generate the kind of one-off returns for investors in H1 usually reserved for the well placed beneficiaries of an IPO, whilst those who thought that they had that particular golden ticket with SpaceX are staring down permanent losses, the performances of H1 are not going to guide us further into H2. Instead, it will be the positions that investors now find themselves in (and with) that will matter most. Bets that were taken – accidentally or otherwise – in the first half are already having consequences at the broader market level. Rotation away from Mega caps has become the “sensible investment/risk management decision” now – despite the M7 being flat on the year and Microsoft ripping up nearly 20% in the last few trading days of July. Similarly, those who bought into the social media related trades around on/off action in the Strait of Hormuz and oil price futures, or grain futures relating to activities in the Black Sea are beginning to recognise that any “information edge” that they might have had is being arbitraged away too quickly to be of value to any but the most well connected.
As the liquidation of the Situational Awareness fund showed – claiming awareness of the potential without acknowledging the risk taken in pursuing it can prove to be a fatal investment decision. Right now, risk appetites are relatively low, but this doesn’t mean that markets are wrong or oversold. As our S&P bellwether chart illustrates, we can go from the top of a “Fair Value range” in May – to the bottom in June and end up in the (trending) lower channel by the end of July even though the level of the Index is essentially unchanged over the period. Sentiment has changed but the price hasn’t. downside risk hasn’t really increased but (the scale of) upside potential definitely has. That calls for consolidation and risk management – not charging the fences in search for high risk/ high return outperformance. As investors look at their (relative) rankings after H1, it would be rash to assume that one can aggressively move up the rankings – but entirely realistic to imagine that you could slip down. As the participants at Cowes will be recognising by the end of the week you can only build your (low score) on the basis of where you already are. Every day may be a race day, but it is not a completely new day.