
The Apollo momentum signal is a measure of the momentum associated with inter-temporal changes in stock level expected returns and the consequent re-estimation of future expected returns by the market. We refer to this as the (momentum) accelerator signal.
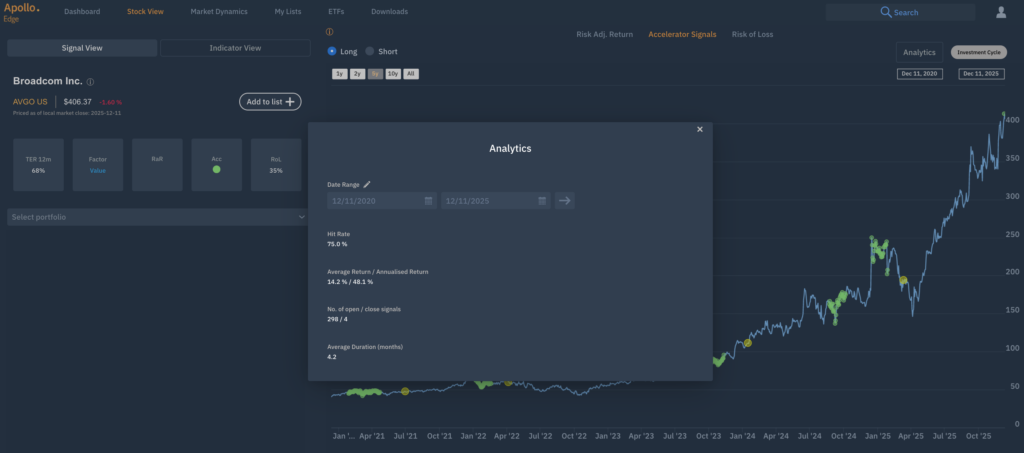
The image shows the Accelerator (long) signal as seen on the Broadcom – this is one of the signals we use within our own Smart Alpha strategies, can be obtained within the Apollo data set and 8000 stocks can be viewed in such a way on the Apollo EDGE platform. We call it data visualisation.
When we set out 20 years ago, the objective was to provide content that would work alongside investor’s own investment process – to provide ‘Need to Know’ moments so that risks and opportunities would not be missed.
The 5 year chart of Broadcom shows that this signal provided;
A hit rate: 75%
Average return following the signal: 14%
Annualised return: 48%
Number of position open signals: 297 over 5 years
Number of close position signals: 4
Average duration per signal: 4.2 months
If you are interested to learn more about the Apollo EDGE platform, review the Apollo data set or / and learn about the Apollo Smart Alpha strategies, do get in touch.