

Mapping the new ocean*

We call our regular Apollo based commentary “The Weather report”. The analogies that we can make with the multiple elements of Value, Momentum and Uncertainty impacting markets in a continuous way chimes nicely with the idea of Currents, Tides and Winds, all impacting the navigation of the high seas. Whatever the nature of the vessel concerned or the skills, experience and capabilities of the crew, the Maritime Weather Report is an essential part of the information system that is required and so the Market Weather Report is designed to perform a similar, essential function.
The market performance over the course of February was dominated by a shift away from the potential of the virtual world to the economics of the real one. Commodities, energy, and metals prices surged, whilst the Mag-7 stumbled and fell back to 6-month lows. Last Autumn’s AI induced excitement faced retracement as worries over the cost/benefit calculations for the hyperscalers, and the potential cap-raising requirements for the (yet to be floated) AI behemoths of Open AI and Anthropic all raised more questions than answers. Throw in a collapse in confidence over the whole SaaS business model and you might be forgiven for thinking that this reviewed AI thematic was set to continue to be the dominating influence for the markets over the rest of Q1 if not longer.
The events that have unfolded over the weekend and into the start of the month have put paid to such thoughts of continuity. Despite rising concerns over the risks of an outbreak of hostile actions in the Middle East, the reality has hit home hard. As Oil and Natural gas prices surge, first-order economic considerations are already giving way to speculations about second and higher order impacts on geopolitical shifts in longer term alliances, supply chains and future patterns of demand. Social media pundits are reaching for their Chinese Zodiac imageries for the New Year of the “Fire Horse” (Energy, Passion, Ambition and Transformation if you are interested) and every “expert” appearing on the 24-hour-news cycle is expressing their learned opinion – confident in the fact that their analysis will most probably be redundant before the end of the day.
Against that backdrop, and following the nautical theme of analysis now established within the weather reports, I had planned to discuss the ideas of Mapping the new Ocean – as illustrated by the IBCSO image at the top of the article. This was prompted by the idea that whatever was happening in the markets – and the Technology sector in particular – is not a zero-sum game. Assumptions about a fixed stock of returns or investible opportunities – for every winner there is a loser, for every economic gain there needs to be a loss – forms a sometimes-frustrating narrative backdrop to market commentary and analysis. It is similar to the idea of “tax cuts needing to be paid for” via spending cuts (or vice versa) without considerations of the non-linear emergent responses within the real economy that policy changes can lead to.
The absence of second or higher order considerations had given me the idea of using the imagery of the bathymetric scan data of the Southern Ocean to make the point that, once we can usefully look for new sources of information about where undersea resources might exist, where seabed topography may reveal new schools of fish or other maritime resources, it enables a potentially different set of options and opportunities to be considered. Not all tech moats are the source of permanent advantage and the breaking down of some existing SaaS models could well lead to a dramatic shift in the order board for sectoral leadership. The need to look for (and with new technology resources the ability to do so) potential returns beyond our well-formed financial sector/factor silos and across traditional boundaries is probably the most significant shift the financial sector faces in 2026 and it was this emergent dynamic for active investment that was set to be the theme for this report.
** Weather Alert **
Well, that was the plan, anyway. Until the events over the weekend. For now at least, all is chaos. That is not to say that markets are in the dictionary chaotic state of disorder and extreme confusion, in crisis mode or collapsing all around us. In some cases, there are obvious signs of distress but elsewhere things appear almost unaffected. No, this is chaos in the sense of the description of a chaotic system – like a weather system (and arguably the real nature of financial markets) where the emergent future patterns of behaviour are not only highly dependent upon initial conditions but are subject to what are known as fractal repeatable patterns of behaviour. New and emergent relationships emerge because of what might seem small, new starting points but lead to fundamental and profound changes over time.
In thinking/talking through current events in real time, I am struck by the similarity to how things evolved in September 2001. At the time I was working late in HK, drafting an end of Q3 Strategy piece for my then employer. A call from the trading floor to come and witness the fateful events of that New York morning left us all in no doubt that, whatever we were thinking or imagining prior to that moment, we had just received a singular “event shock” that would change the pattern of everything going forward. We didn’t perhaps take the chaos theory approach back then (although the “butterfly effect had been a popular topic since the 1970’s) but it is easy enough with hindsight to frame the subsequent events of the period through such a lens.
The temptation to simply rerun the 2001 evolving script of: initial instincts despite the extreme uncertainty (“Buy the dip!”), through the early stages of disappointment at the false optimism, confusion, policy observation and eventual realignment is probably best resisted (and chaos theory itself would urge us not to do so!).Whilst it did feel a little like a real world Kubler-Ross psychology framework, there is no sense to which one was aware at the time of where we were in the process. Moreover, unlike 2001 when we were acknowledging that this was perhaps a “nothing will be the same again moment” it wasn’t exactly an “everything has changed” moment. Are we in that phase now? Clearly no one is able to address that in absolute terms, but we can perhaps take the view that perhaps “everything IS changing” although we cannot realistically determine where things will settle.
So, chaos it is then. Yet, the IBSCO chart may remain a relevant analogy. Looking at things as they stabilise will reveal both the risks and opportunities of the post event world. Old alignments of risk and reward may shift marginally – or massively. We cannot tell for now. Will Oil and Natural Gas prices remain elevate even though a lot of the technical positioning in the markets were already set for a directional move higher? Does the immediate aftermath of the Ukraine Crisis in February 2022 give sight to the risks to global energy, foodstuffs and fertiliser supply chains for the wider world that are already the “certain” first round effects of events in the Middle East? Will the stresses already existing in the Private Credit markets lead to a crisis as global liquidity demands undergo a step change? Will Middle Eastern capital flows destabilise the flows in Global Real Estate activity or in raw commodity (and their derivative) markets and what does that imply for the response from Central Banks, Sovereign Wealth Funds, or mobile global wealth?
The good news for this framework of analysis is that the Apollo system utilises exactly this approach already. An open, complex adaptive system model such as Apollo is one that operates with a combination a deterministic and a stochastic component to risk and reward. The components of chaos theory are fully described by such a process and at the asset level tit allows risk and reward to be quantified, analysed, and utilised in the formation of signal generation, stock selection and portfolio construction. Contained within each of these component functions there is a probability- based element that combines dynamically to provide the boundaries of the overall expected return model. Simply put, that “prediction market” style component currently has no boundary level guidance. Expected returns become a “conditional mean” expectation without being able to quantify either the potential upside or downside with any forward guidance. We can obviously look to historic “norms”, but we are currently in the low confidence low-predictability phase of things right now. That doesn’t have to be a problem, but it does need to be recognised.
Review of Performance – under the surface
The structure of this weather report has already gone way of from its normal script, but it is now appropriate to get back to more normal operations. In doing so we can help frame these all-important (new) initial conditions from which the divergent market conditions of 2026 might now emerge. In taking our normal look at some of the recent performances of the main market indices through the lens of the Apollo strategy models (price performances are to index close values from 27 February 2026) we can therefore set out our thoughts of where we are starting from anew.
The 6-month returns in Table 1 take us back to September whilst the 3-month number taking us back to the start of the post Thanks-giving period – just before December distributions and reinvestment/rotations took place in the US Mutual Fund sector.
Table 1: Performance Report (price returns%)
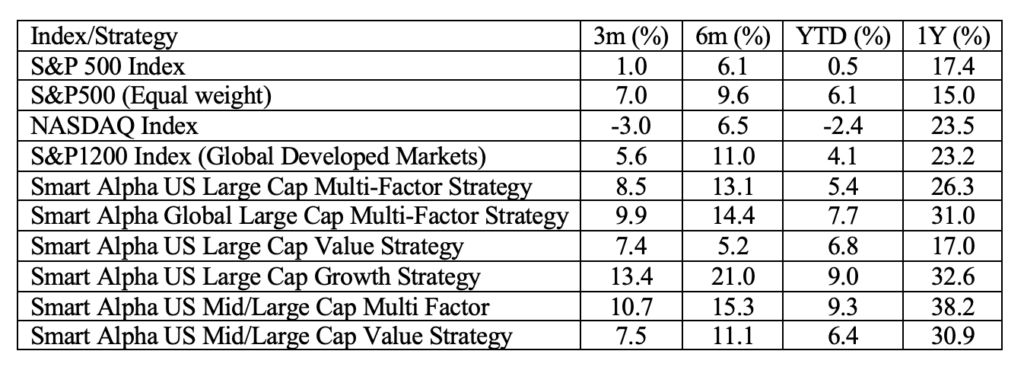
The selection of Smart Alpha strategies that we run (and publish – see https://www.libra-is.com/strategies ) are reflected here and we categorise all the stocks under coverage by “style factor” based upon our own, fundamentally derived classifications (Value, Growth, Quality, Junk etc.) using the Apollo model for expected returns.
Risk (and returns) by Factor
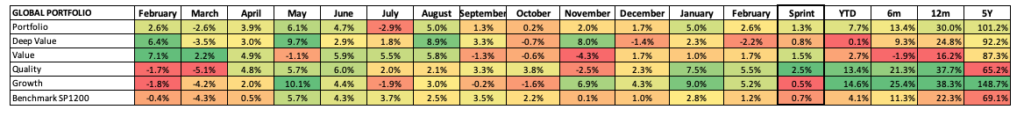
In terms of the sector drivers that we can see in Table 2, the differentiated drivers of the Global Multi–factor portfolio from the sub-portfolios YTD has been from Quality (+13.4%) and Growth (+14.6%). This is an important divergence in the current market situation as risks to both Factor categories are likely to be both pronounced and defensive in nature as de-risking from the recent equity winners and from potential casualties in relation to increase uncertainty about more intangible future growth. We could see these as not only areas for profit taking (and clearly there aren’t a huge amount of those to be taken right now) but also de-risking at the portfolio level.
Table 2: Global Factors
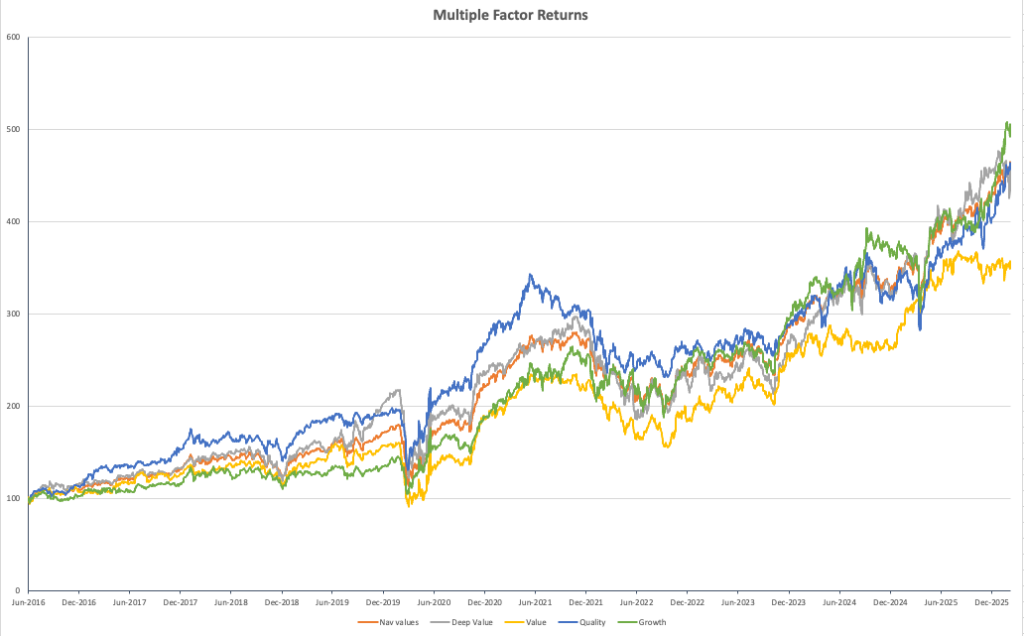
This is reinforced by observing the longer-term compounding portfolio and sub portfolio NAV chart shown in Chart 1. Quality – the dominant (blue line) from 2016 onwards remains aligned with both the total portfolio (orange) and clearly ahead of value (yellow) over the total period with Growth a clear compounding winner over longer horizons and, the dominating factors of late. Meanwhile, the sharp drop off in relative performance of Value is thrown into sharp relief in the chart, suggesting that broader risk appetites have already been muted in recent times.
Chart 1: Compounding returns
Weather Forecast – “Events, dear boy, events”
We rounded off last year with a discussion of global prospects for the year ahead and noted that currency related issues with respect to a weakening of the US$ would probably form the basis of ongoing conversations about diversification away from US$ exposures by both US and international investors and how that could shape capital flows in the first half of 2026. Recent events are likely to give impetus to such flows – only for now at least – it is impossible to say in which direction – something former UK PM Harold Macmillan was reflecting on in respect to his quote above. With (currently sharply rising) commodity prices being US$ based how will existing precautionary futures positioning now unwind? Will the capacity to match physical delivery with contract commitments create pricing tensions similar to those seen recently in the silver markets across a broader range of physicals or will $100+ /bl oil prices force out major reversals in futures? We can only speculate on such things, but we are at least aware that such second order externalities across multiple markets now have the capacity to disrupt in a way that is far beyond what we were concerned about at the end of last month.
Chart 2: The S&P bellwether
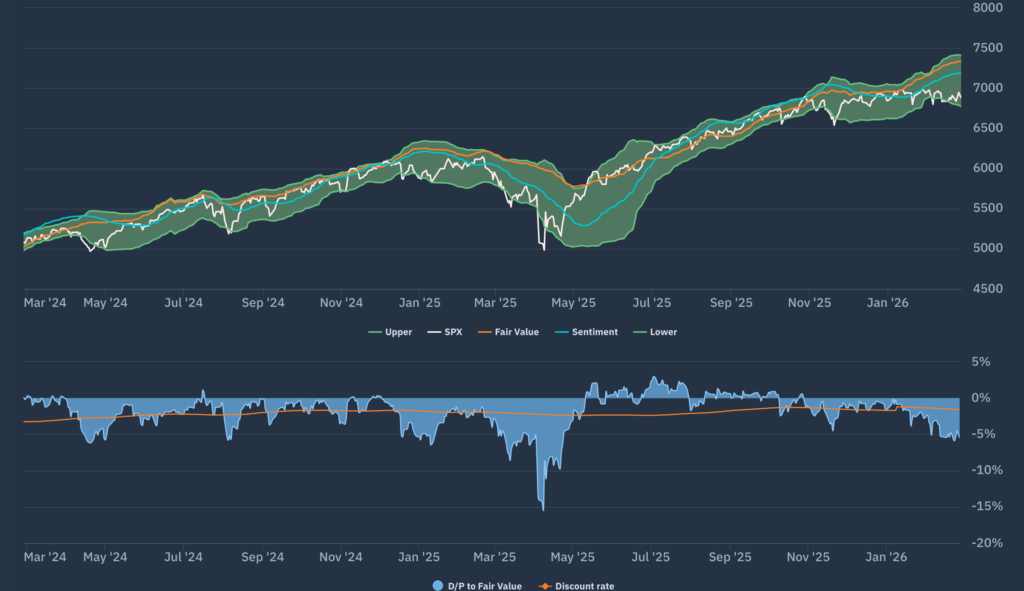
If we take a look at the Apollo market chart for the (market Cap weighted) S&P500 shown in chart 2 we see a market that, despite improving growth expectations (a steepening of the orange fair value line) and sentiment (the blue line) has sunk to the bottom of the FV range. The width of the FV range started to widen once again and it appears that even before the events of the weekend, US markets were “not buying it” .
Moving down a level, we can look at whether there are any sector level dynamics now emerging that can be used to read across to other markets and Chart 3 is the Apollo chart that we use to do so. This is the Apollo beta heatmap for the S&P500 that shows the relative sector rankings in terms of rolling 1-month returns across the main US S&P500 market sectors, ranked by relative market beta from high beta (cyclical sectors) down to low Beta (defensive sectors).
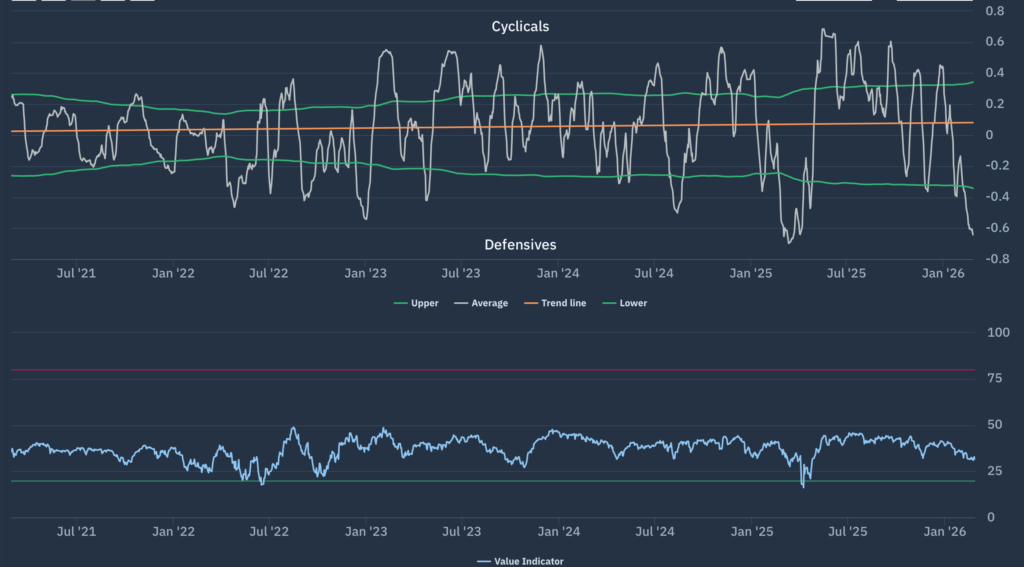
We can observe the unequivocally negative performances across the higher beta cyclicals versus a universally positive swing towards defensives. This is unlikely to be a coincidence. It is in stark contrast to the broadly “net beta neutral” calendar year start that we noted last month following a strong start to the year. We can illustrate this as a “Macro indicator” via our Net beta chart (Chart 4) which we can define as the net exposure bias between defensives and cyclicals. For reference, as of last Friday we are already back at the 5-year lows experienced in April 2025.
Chart 3: Apollo S&P500 Sector Heatmap
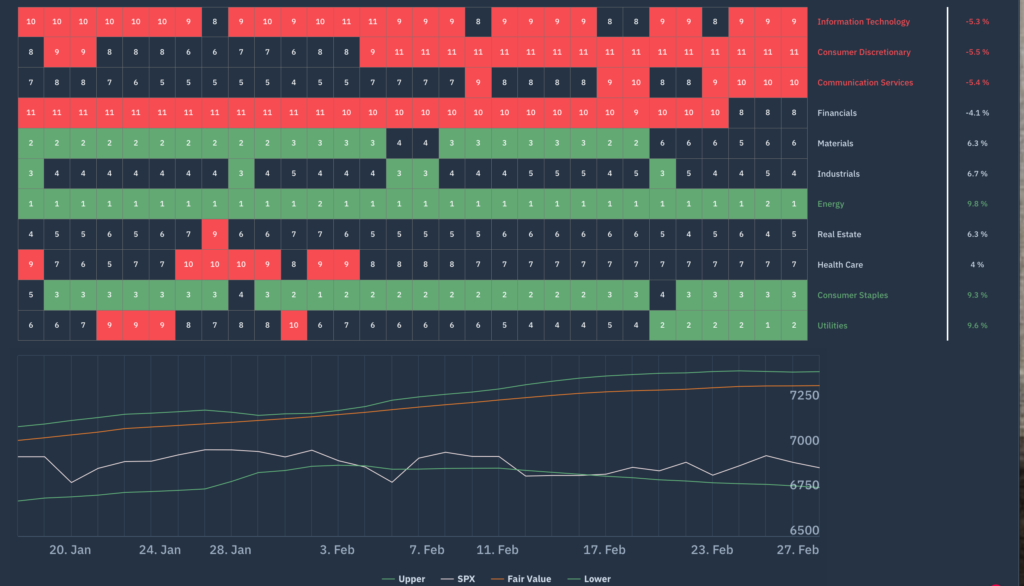
Chart 4: Apollo S&P500 Net Beta Chart
Forecasts and conclusions
It should be clear from our initial observations of recent developments and the analysis of evolving market conditions in the period immediately prior to them, that markets have not seen something suddenly emerge “out of a clear blue sky” a la 2001. Caution was already the watchword across much of the markets as we came to month end, and was part of the reason for the focus upon a differentiated view of how to view “the new Ocean” outside of the more traditional silos of risk and return. It goes without saying that the nature of current events and their potential end results are going to be the subject of endless speculation and discussion and there will doubtless be “short term winners” and “obvious losers” that will garner the headlines of the financial markets in coming weeks. However, it is going to be the understanding of what will be the new, longer-term, emergent structure and dynamics of the Complex Adaptive System (CAS) that the Financial Markets operates as in the real world that will be more important than ever to be able to analyse. Using the Apollo framework to help understand these complex system dynamics is a key element of how these weather reports can aid investors going forward.