
The (t)ides of March
March 2026 has turned out to be quite a landmark month for investment funds. With the opening of hostilities in the Middle East on February 28th, the opportunity to review the before and after total return performances – February – versus – March has been an obvious one. An “out of sample” test if you like, as little in terms of price action in March can be considered independent of the events in the Middle East. From a risk perspective, these opportunities only occur infrequently. Covid was one example and (arguably) the start of the Ukraine war another, but when external events fundamentally change the investor landscape for the foreseeable future, both the nature and construction of investment strategies are put under the spotlight.
Having recently completed our Smart Alpha Evolution – from the Smart Alpha Global (long only) strategy based upon the S&P1200 universe and using a relatively concentrated, equal weight, 48 stock model to a 130:30 extended strategy version (48 long, 14 short) and a full Market Neutral Long Short strategy (48 long vs 48 short) it made sense to review how these strategies have fared over the recent period. All data is based upon total returns as generated on the Indexone platform and are expressed in US$.
Although it is tempting to treat events as only starting in March, A closer look at February is quite revealing. The total return on the S&P500 was flat (-0.9%) for the month; suggesting that sentiment was already deteriorating before the start of March and a point that we made in the March Weather report written at the start of hostilities. We also noted at the time that the total return in January – a month that started out so well for those who were looking to diversify away from the concentration risk of the mega cap US names (Global Large Cap were up (+2.9%)) – was hardly a stellar month for Large Cap equities (+1.5%). Something was in the price – we just didn’t know exactly what.
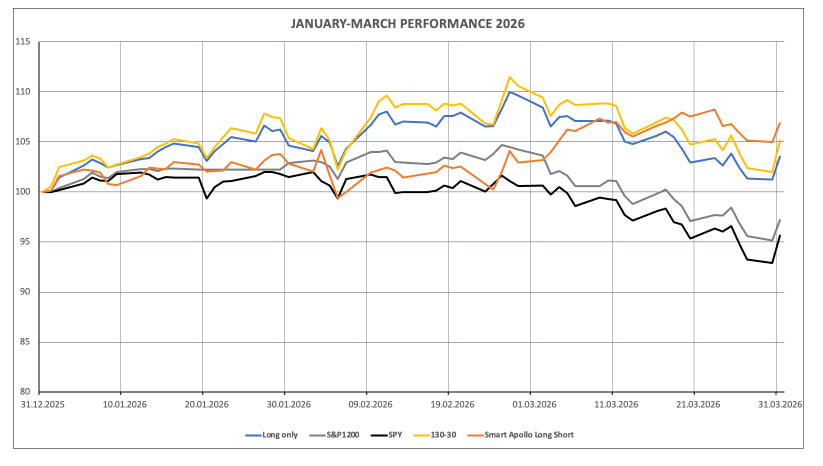
The accompanying charts are very instructive in this respect. Chart 1 shows the total return performances of the Apollo Smart Alpha Global Long only, Global Extended 130:30 and Global Long Short alongside the S&P500 and S&P1200 benchmarks with January 31st 2026 =100 whilst Chart 2 shows the same data set with December 31st 2025 set to 100 in order to concentrate on the quarter as a. whole.
The data summary is shown in Table 1:
Table 1: Results for the Smart Alpha Strategies – Q1 2026
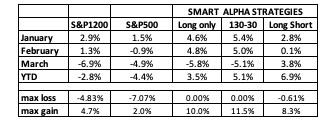
Chart 1: Total Returns of Smart Alpha Strategies February- March 2026
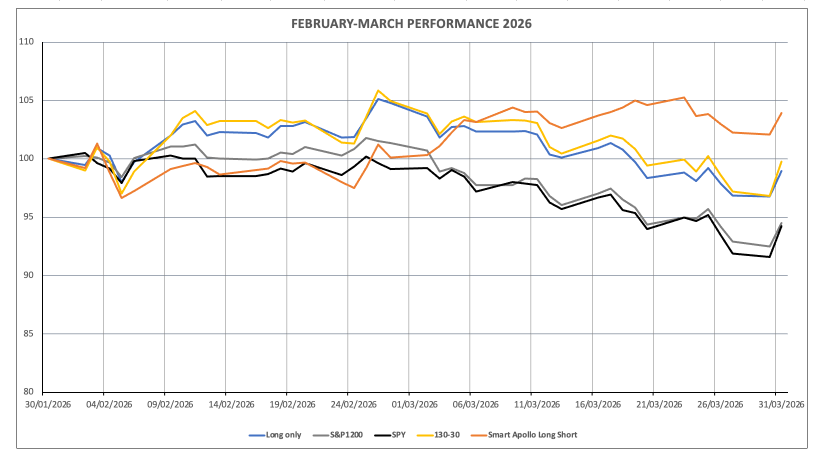
Chart 2: Total Returns of Smart Alpha Strategies January- March 2026
From the data table and from these charts, we can see that the Smart Alpha Long Short strategy (orange line) had a major relative outperformance over the benchmark in March (+3.8%) vs (-6.9%) and, as of end March was showing a (+6.9%) YTD performance versus the S&P1200’s loss (-2.8%). For context, these results are generated with a strategy that is rebalanced every two months with a last rebalance in Mid- February. There is no active news flow or event trading outside of these regular rebalances. The big loss days for AI: February 5th – when stocks like SMCI, Amazon and Oracle fell sharply and February 23rd when the AI concerns for SaaS stocks were at their peak mark the lows of the Long short strategy in Q1 (February 5th was the only day where the Long Short Strategy demonstrated a minor loss for the Quarter-to-date)and matched the lows of the S&P500 during that period as can be clearly seen on Chart 2.
Calmness under fire
The point is not to focus in too much on the daily price action – particularly in such a news driven environment – but to recognise the benefit of running a Long Short strategy from a risk perspective when events such as these suddenly occur. Reviewing the relative trends visible in Chart 2,the impressive thing here is not only how the Long Short strategy moved swiftly higher after the start of hostilities – moving ahead of the S&P1200 benchmark for the YTD on 3rd March but how it consistently so through the bulk of March, with only relatively small underperformances occurring when the markets rallied sharply on February 24 and into February 25th as the US “15-point peace plan” was announced.
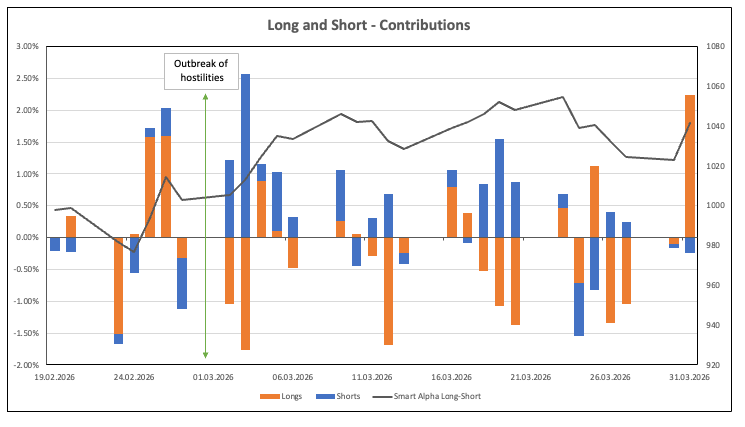
A deeper dive into the relative performances of the “Long” and Short” portfolios is shown in Chart 3. Over the 22 trading days in March, the “Short portfolio” had 7 down days (3 of which were also down days for the “Long portfolio”) and 15 up days, whilst the “Long portfolio” had 13 down days and 9 up days (5 of which were also up days for the “Short portfolio”. For reference, the S&P1200 had 6 up days and 16 down days over the course of March
Chart 3: Long Short Contributions

This pattern of risk mitigation in relatively high volatility environments is a hallmark of a long-short approach. It is important to note that for the 48:48 strategy, the shorts are primarily there for alpha purposes – not simply as a hedge against the longs. The degree of correlation to the benchmark should be low (this strategy has an R-squared versus the S&P1200 of 0.14) the correlation between the longs and the shorts should be relatively high if alpha is to be consistently generated. The Pearson correlation coefficient (Pearson’s r) for the linear relationship between the longs versus the shorts for this model is an attractively high 0.79.
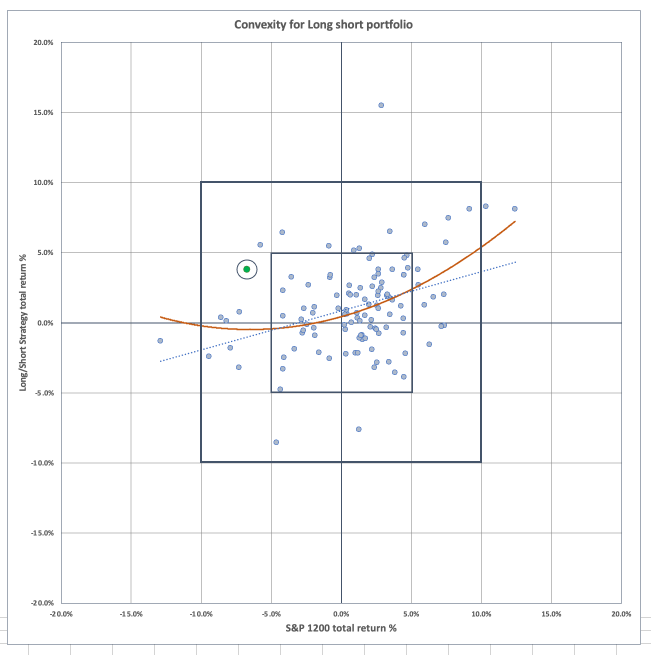
The end-result of this was a de-facto hedge against the external shock of the Middle East conflict and a monthly performance that is amongst the highest of relative returns (+10.6%) we have seen with this strategy (and something nicely illustrated on Chart 4 below). When outside of “normal conditions” (i.e. non-linear) we clearly want there to be a positive hedging capability and a degree of convexity against the benchmark for a long-short portfolio. In simple terms, this means that when the benchmark returns (on the x-axis) are strongly positive or strongly negative, the strategy’s excess returns are consistently positive. This is shown in Chart 4 by the upward curve (convexity) of the monthly total returns of the strategy (y-axis) relative to the benchmark (x-axis) over the last 10 years. The March 2026 result is highlighted in green (circled) below (-6.9%, +3.8%) and illustrates the non-correlation and extreme conditions-hedging benefits of such a strategy already described.
Chart 4: Long Short Convexity
What happens next?
As this goes to press, we are in the first stages of a newly announced ceasefire in the Middle East. What does that imply for potential upside from here? Double guessing the next few weeks would be a fool’s errand, but early-stage rallies are possible/probable as oil prices drop and macro nerves subside. Volatility, however, is highly likely to persist. Relief rallies notwithstanding, the next few quarters are going to be more about effective and consistent risk management than simply chasing momentum and headline returns. Markets are more likely to recover back to positive YTD territory now, but as we saw last April, news flow and positioning ahead of events and during the review of their aftermath often leads to clarity only existing in hindsight. In light of this, monthly performances in April, May and June this year are far more likely to look like February and March 2026 than May, June, and July 2025 and both the directionality and predictability of returns is likely to remain unclear for some months yet.
Managing risk is key
This Focus of all this is the key element of management of returns – not taking the losses in the first place. To put this in context, if both the S&P1200 benchmark and the Smart Alpha Long Short Strategy rallied by 5% from their end-March levels, the benchmark would only be up 2% YTD whilst the Smart Alpha long short model would be up 12.25% – in other words the benchmark would have to increase by 10% from its end March levels to be level (in total returns terms) with the Smart Alpha long short strategy rising by 0% over the same time frame. By contrast, if the Smart Alpha strategy rallied by the same amount (10%), it would then be (+17.5% YTD). Whilst the past is no guarantee of future performance, the convexity chart above suggests that the scenario where the benchmark rallies by 10% but the long Short is totally flat is highly unlikely. The fact that the market would have to put in an extreme positive performance in order to beat the long-short strategy only needing to do nothing is a salutary reminder that risk management is about more than just reducing volatility.
Final Thoughts
Even ahead of March, there was a sense that, with the “sudden reality” of AI and a range of technically sophisticated solutions to “solving” investment challenges appearing in its wake, a new world may be emerging for investment in general. The evolution of Smart Alpha that we have written about recently is already seeking to take that onboard and provide strategies that are, perhaps, timelier and more relevant to this brave new world.
If the past few weeks have taught us anything, it is that modern investment strategies need to not only deliver consistent, non-correlated returns (alpha) but also be able to withstand events such as the ones seen in recent weeks as part of their structural integrity. With news of a two-week ceasefire coming overnight, we can perhaps have some grounds for optimism that the worst may be behind us. However, the shift towards higher intensity news flow-related trading and the evolution of a more prediction-style market for asset prices that we discussed in our most recent Weather Report, suggest that the way investors are engaging with markets has created an additional catalyst for this change. This newer way of operating is arguably here to stay, along with persistently higher levels of volatility and portfolios must adapt to it. Decisions about where and how best to invest need to be put alongside how well risk managed and robust these investment strategies are – and underscores how important the concept of an “all-weather” portfolio is likely to be for investors going forward.
Changing of the Guard?
At the start of the year, the arguments for wealth clients and institutional investors to diversify and seek out Hedge fund exposure to boost returns was manifest. The March results of a large sway of such funds should serve as a cautionary tale. Less than a third of funds reported positive March returns (putting the Smart Alpha long-short (+3.8%) performance in a very positive context) and many high-profile Hedge Funds showed major losses on the month. Not only do some of these results show a high degree of correlation to the benchmark at a time when diversification would be expected, but a significant number of funds are showing YTD losses too. Returns to leverage are not always “risk free” when markets correlate directionally and perhaps a few of these Funds are showing themselves to be Warren Buffet’s “naked swimmers” as the tides go back out. As investment styles and risk appetites change, the need to diversify away from “traditional” investment products is recognised and (in many cases) already being acted upon. However, this is not simply the case of diversifying away from one form of traditional product into another (traditional form) of investment. If a Macro Fund, Multi-Strategy Fund or momentum-style CTA is not able to provide the kind of risk management offset in March 2026 that might be expected of them, then they will need to change their processes going forward if they are to succeed.