

Catfish season…

We call our regular Apollo based commentary “The Weather report”. The analogies that we can make with the multiple elements of Value, Momentum and Uncertainty impacting markets in a continuous way chimes nicely with the idea of Currents, Tides and Winds, all impacting the navigation of the high seas. Whatever the nature of the vessel concerned or the skills, experience and capabilities of the crew, the Maritime Weather Report is an essential part of the information system that is required and so the Market Weather Report is designed to perform a similar, essential function.
As we stop to review the markets in the aftermath of the Thanksgiving holiday and a far more volatile November than most had anticipated, perhaps the dominant theme has been the “awakening” of many investors to the sometimes-problematic nature of the AI story that has been the dominant driver of investment stories this year. As the internet lit up with images illustrating the circular nature of the relationships between Nvidia, OpenAI, Microsoft, Oracle, CoreWeave, Intel, AMD and others, the penny has seemingly dropped that perhaps all these announcements of surging investments, datacentre buildouts, and revenues from the AI story were perhaps not quite what they had seemed to be earlier in the year.
Stories have abounded about seemingly genius insider investors making a fortune in the AI story whilst others have been taking massive, short positions on the other side of it. Meanwhile Bitcoin’s rollercoaster has served as a reminder of where and how quickly high-risk liquidity can shift on marginal changes in sentiment.
According to the Urban Dictionary, “catfishing” is when a person uses a fake online identity, often on social media, to trick someone into a relationship or friendship. To the extent that we could describe 2025’s AI phenomenon as a learning curve for the financial markets, perhaps there has been an element of catfishing going on for investors too, as what was presented to markets earlier in the year was “not exactly” what ended up being on offer after all. This started back in January when Deepseek appeared over the horizon and was presented as an alternative model to those proposed by the US main players. The crash/recovery in April after Liberation Day and then the rally into Independence Day appeared to lay the groundwork for a Q3 surge in AI positivity, with over 80% of all market performance being attributed to the AI theme by the end of October (alongside a significant level of Economic activity being similarly attributed to it). A degree of M7 indigestion notwithstanding, the AI story appeared to be set to drive us onwards to year end. The collective investor base was fully on the hook for the biggest investor story of a generation right up to the end of October.
Review of Performance – Crisis? What Crisis?
Yet as we observed last month and in the Almanac piece earlier in the summer, the reality of the Investment Calendar in the run-up to year end often sees Thanksgiving – as opposed to end-December – as a destination point for market return watchers. As the mixed messages from the US Federal Reserve – combined with a trend towards capital preservation by those who did not want to give back the hard-earned gains of the last eight months, – prompted a “wobble” mid-month; precipitated by cross currents from Bitcoin and heavier waves of selling as books became flattened by momentum traders and trend followers alike, a significant de-risking phase took place. Meanwhile, the Q3 NVIDIA report that marked the end of the reporting season took on the feeling of a major Macro data point. The relief that followed those figures was palpable in the run up to Thanksgiving itself and has allowed the market to close essentially unchanged over the month – rather disguising the mid-month turmoil. With futures and options shorting having continued through into the shortened holiday week and with the corporate buyback window now fully open, extreme downside risks seem to have abated.
As has become the norm for the Weather Report, we can take a closer look at some of the recent performances of the main market indices. With the 6-month return taking us back to the start of June and the 3-month figure reflecting the post Labor Day period.
Table 1: Performance Report
| Index/Strategy | 3m (%) | 6m (%) | YTD (%) | 1Y (%) |
| S&P 500 Index | 6.0 | 14.7 | 16.4 | 14.2 |
| S&P500 (Equal weight) | 1.6 | 8.1 | 9.0 | 2.0 |
| NASDAQ Index | 8.8 | 20.6 | 20.4 | 19.6 |
| S&P1200 Index (Global Developed Markets) | 5.3 | 15.1 | 19.6 | 17.3 |
| Smart Alpha US Large Cap Multi-Factor Strategy | 4.6 | 10.9 | 24.2 | 20.0 |
| Smart Alpha Global Large Cap Multi-Factor Strategy | 3.7 | 10.5 | 29.5 | 27.0 |
| Smart Alpha US Large Cap Value Strategy | -1.5 | 6.5 | 15.6 | 10.5 |
| Smart Alpha US Large Cap Growth Strategy | 7.1 | 11.1 | 19.0 | 15.6 |
| Smart Alpha US Mid/Large Cap Multi Factor | 4.6 | 16.0 | 28.5 | 21.1 |
| Smart Alpha US Mid/Large Cap Value Strategy | 3.8 | 16.5 | 27.5 | 19.9 |
The divergence in performance between the headline S&P500 market cap weighted index and its equal weight counterpart remains stark over both time frames but perhaps most dramatically so over the last 12 months. The headline Index (+14.2%) vs. the equal weight index (+2%) is a reminder of dominance of the Mag-7 in terms of headline returns and the themes surrounding AI that have also driven the performance of the NASDAQ over the last six months up by (+21%). With our perspective that an increasing proportion of the US investor community has shifted to a “Thanksgiving-to-Thanksgiving” (T-to-T) annual calendar, this really emphasises how difficult a non-market cap weighted, passive investor could have found that period. The average weight difference in Technology stocks – the Mag -7 effect- between the two indices is 18.8% (in favour of the Market Cap weighted) but interestingly, the total return differential with the highest bias was the Communication services sector where the equal weight index’s exposure to the somewhat smaller caps in communications (-31%) and Tech stocks (-9%) explains the other side of the coin. In other words, it is not just the relative underweight in Big Tech that hurts the equal weighted index but the relative overweight in smaller, poorly performing cyclicals too that has led to this headline level divergence. If those divergent themes are looking less convincing now, then these gaps may start to narrow, but for those focused upon period returns for 2025 as a whole (and therefore the YTD figure) the gap remains uncomfortable for those underexposed to the M7 phenomenon so far this year.
From a more global perspective, we can look at the performance of the S&P1200 developed market index (the S&P 500 plus 700 “other Developed market Large cap” stocks). This benchmark has 3 and 6-month performances that correspond closely to the US large Cap (S&P500) index and a slightly higher, NASDAQ level of YTD return; up (+20%) YTD in US$ terms. As such, it continues to provide a credible “diversifier” for those worried about over exposure to the US economy per se – although with around 69% of the Index being made up from US stocks this is still heavily US-centric and retains the same market cap weighted bias towards the Mag 7 that the S&P500 exhibits.
“Smarts” from Smart Alpha
To build out on these headline observations, we can use a selection of the Smart Alpha strategies that we run (and publish – see https://www.libra-is.com/strategies ) to capture some of the underlying dynamics that appear to be at play. We construct these portfolios to help us access the excess returns that are available from the markets on an ongoing basis but, in doing so we are also able to gain a degree of insight as to what might be “working” at any point in time that can help shape expectations for the coming investment period.
With the Libra Smart Alpha strategies, we categorise all the stocks under coverage by “style factor” based upon our own, fundamentally derived classifications (Value, Growth, Quality, Junk etc.) using the Apollo model for expected returns. We then construct concentrated (48-stock), equal-weight, factor-based portfolios selected from the relevant underlying universes (S&P500, S&P1200 etc.) to reflect the “best” performing elements of those universes and generate excess returns.
What we can see from those portfolios (see Table 1) is that on a six-month basis (on an equal-weighted basis) the difference between US mid and large cap (+16.5%) and US large cap value (+6.5%) has been significant. Indeed, the more recent relative disappointment of large cap value (-1.5%) over the last three months stands at odds to all other portfolios we feature in the table. Returning to the equal weight to market cap weight discussion, it is important to note that the Apollo Smart Alpha large cap (48 stocks equal weighted) is up by 20% over the last twelve months (the T-to-T window). As an example of the importance of stock selection, this underscores not only the importance of what to own – but what not to.
Looking at this from a broader, global level, we can dig into the top line and factor performances of our Global S&P1200 Smart Alpha strategy for further insight. The benchmark (which includes the S&P500 stocks but adds in 700 other large Cap stocks) showed an earlier recovery from the April sell-down than the US benchmarks, but that difference has now narrowed as the performance over the second half of the year has converged with that of the S&P500 and the Benchmark currently stands at (+19.6%) YTD in US$ terms. As we have noted previously, our Smart Alpha strategy based upon this benchmark rode out the April sell-off very quickly indeed and was back in positive return territory within a week. As a result, its strong YTD performance (+29.5%) reflects the kind of stable, persistent return throughout 2025 that is consistent with not only that Q1 performance but a steady excess return over the rest of the year with only one negative month (July).
Risk (and returns) by Factor
As a reminder, when we construct a Smart Alpha portfolio, we not only rank stocks based on our risk adjusted expected returns, but by investment factor category. This is a crucial part of the risk management process embedded within our portfolio construction. At each rebalance we construct a 48-stock equal weighted portfolio with equal investment factor exposures to the factor(s) concerned. For example, we can construct a simple “Quality portfolio” by selection from stocks that Apollo categorises as Quality or a “Value portfolio” with equal exposures to Value and Deep Value stocks. We can also construct a factor neutral portfolio ( the one shown here and in table 1) with equal exposures to Deep Value, Value, Quality and Growth (with zero exposure to Junk or other high-risk categories) This ensures that there is no unintended or persistent factor bias embedded in the portfolios.
We remain big advocates of this strategic approach. In terms of the sector drivers that we can see in Table 2, a major impact on our Global Multi–factor portfolio from the sub-portfolios that we build as part of the process has been a big factor bias towards deep Value (+42%) and Value (+30.3%) compared to Quality (+26.6%) vs Growth (+16.1%) on the YTD measure. Worth noting is how the Deep Value bucket and the Growth Bucket both surged further in November following the rebalance of the latest Sprint (this commenced mid – October) whilst the Value and Quality sub-portfolios slipped back.
Table 2: Global Factors
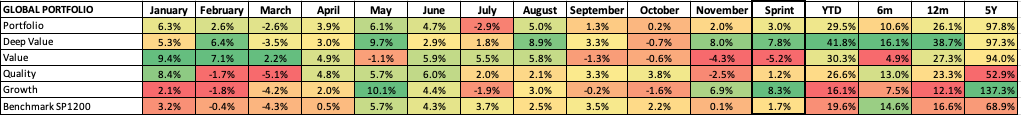
If we contextualise this over slightly longer time frames, the last six months saw the overall Smart Alpha portfolio up by less than the benchmark (10.6% vs. 14.6%) but YTD (+29.5% vs. 19.6%) as the recovery path was more measured throughout the year as a whole – performing more consistently throughout the whole period.
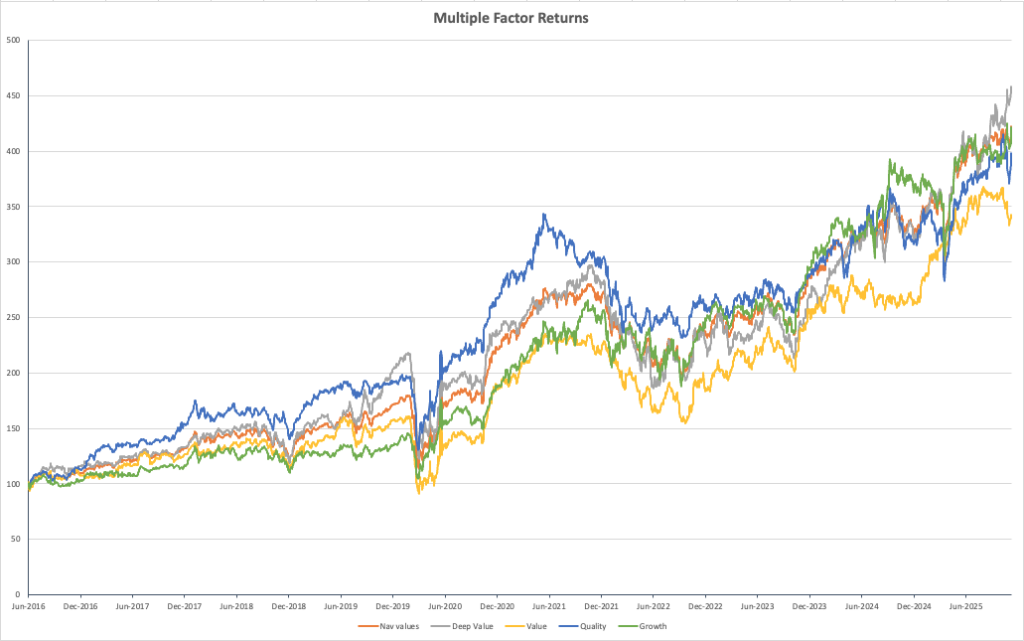
The longer-term compounding portfolio and sub portfolio NAV chart shown in Chart 1 highlights how the factor outlooks have diverged not only recently but over the longer term. The disruptions in 2020 continue to leave the 5-year return numbers a little misleading at the headline level but visually Quality – the dominant (blue line) from 2016 onwards remains aligned with both the total portfolio (orange) and clearly ahead of value (yellow) over the total period. Meanwhile, the sharp drop off in relative performance of Value is thrown into sharp relief in the chart.
Chart 1: Compounding returns
Weather Forecast – Steady on the tiller
External factors have had a bigger impact than anticipated this year and the emergence of such an overwhelmingly dominant investment theme (AI) was not on most radar screens either a year ago. As ever, we would advise investors to look to the structure underpinning their own process as a means of managing their way into 2026. Understanding the drivers of returns for the broader markets – as well as the narrower focus upon specific sectors and stocks is a critical part of “reading the weather” for the period ahead.
To return to our familiar nautical (financial) themes of Currents (value), Tides (momentum), and Winds (uncertainty), the forecast for 2026 now looms large. It is fair to say that even though (from the benefit of hindsight) YTD Equity market performance has been acceptable for most benchmarks, little appears to have really gone to plan on the active front. Value surged – then faded. Momentum reversed and then stalled. Uncertainty persisted until it was overwhelmed by rhetoric. Currents, tides, and winds all combined to push markets persistently away from expectations, and rewards did not really appear aligned with risks. Indeed, much of the YTD benchmark performance has come from passive structuring of indices that, despite the rhetoric, most (non-passive) investors still appear to track closely. Still, that was the past. A steady hand on the tiller is what we will need going forward. With the lessons of 2025 now (mostly) in the locker, a return to process and analysis is now due.
Looking forward to 2026
The Apollo market chart for the S&P500 shown in chart 2 below helps to add context to this. The narrowing of the FV range that had remerged in late October was short lived and has now widened significantly as uncertainty about near term returns accelerated. Ona similar basis, whilst our proprietary measure of sentiment (the blue line) still indicates upside near term, that trend has now flattened. A brief breakdown below the lower boundary of the FV range gives rise to further near-term caution. This pattern is not inconsistent with the recent past – the “flash-crash” of August 2024 gave rise to a very similar set of “risk-off” characteristics, but now – as then – we should not get too unnerved. Risk unwinds in Crypto are still the backdrop to monitor for short term nervousness, but the shakeout for equities in recent weeks appears to be manageable.
Chart 2: Apollo FV range for S&P500
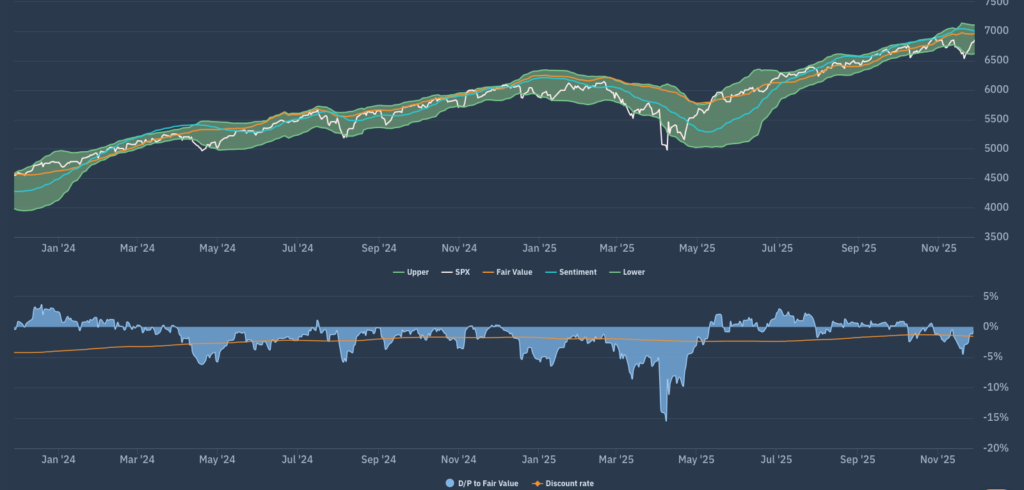
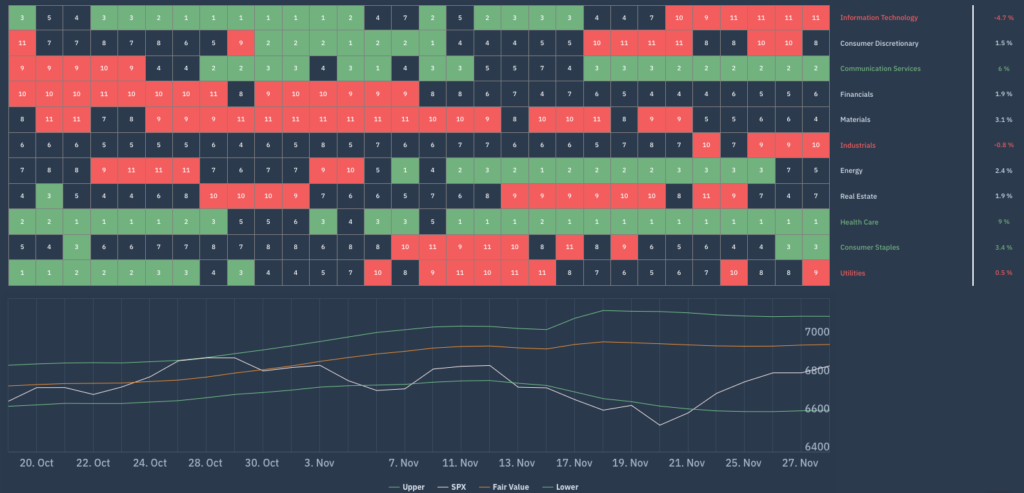
Chart 3 is another interesting counterpoint that we use. This is the Apollo beta heatmap for the S&P500 that shows the relative sector rankings in terms of rolling 1-month returns across the main US S&P500 market sectors, ranked by relative market beta from high beta (cyclical sectors) down to low Beta (defensive sectors). This illustrates how the strength of the Tech and consumer discretionary sectors collapsed mid-month whilst the Healthcare and Energy sectors continued their steady recovery.
Chart 3: Apollo S&P500 Sector Heatmap
Conclusions
The sense that Equity markets needed to “deliver” in the latter part of the year was something that we noted in both the September and October weather reports and, if we look at the headlines, one could make the argument that over the last three months they appear to have done so. Yet beneath the waterline, a lot has been changing. Concerns over Tariffs already seems “so last year” whilst the flurry of AI-centric stories that had dominated market conversations throughout the summer and Autumn do appear to being treated with a slightly more cynical eye. Catfish me once – “…shame on you” – catfish me twice….
Meanwhile our focus upon factors as risk management tools continues to prove itself a credible and rewarding methodology. Regular “rebalancing to neutral and equal weight” in terms of factor level risk alongside relatively concentrated (around 50 stock) active stock selections based upon our own forecasts of expected returns provides both insight and reward. We can’t predict the exact nature of the weather ahead, but as we noted in our piece back in May “Round the Horn” we have already moved into a “New Ocean” where the currents, tides and winds may feel much the same but end up having sometimes quite different impacts upon us than anticipated. For then – and now – the title of this forecast “steady on the tiller” seems a very credible piece of advice for such conditions.
A final thought: A financial media that has ramped up every AI headline to the max will doubtless begin assailing us with more Santa Claus rally narratives than any sane investor can stand because – well that’s what every LLM will articulate when challenged about the post-Thanksgiving market period. (Arguably AI- generated media is fast becoming a self-feeding beast with over 50% of online news being claimed as AI generated.) However, just because it is anticipated doesn’t mean that it should be ignored. As we discussed last month, there are real seasonal factors at play in December (the corporate buyback calendar for one) and even a modest shift in Geopolitical conditions could prompt a cheery run into year end.