

the key to Risk Management
As the US market shifted into holiday mode ahead of the US Holiday weekend, a superficial lookback over the first half of 2025 could have led many to conclude that a YTD 6.75% return on the S&P500 wasn’t such a bad result, considering. So long as one can “ex-post rationalise” the sell-off and bounce back in April as an aberration, then an implied annualised return of 11.8% was simply business as usual (the annualised return of the S&P500 since 2018 has been 11.3%). However, given that the bulk of that positive return only appeared in the last ten days of H1 as positions were adjusted into quarter-end and rolling 12-month highs were only recovered by the 26th June, a psychological sense of being basically flat since December 2024’s highs, would arguably be a more sober perspective of the performance of the S&P500 Index up to July 4th.
Of course, the optimists amongst us could take the 3-month price return of the Index (coincidentally picking close to 2025’s market lows), annualise that – and conclude that, at that pace we were on track for a 135% return in 2025! Clearly very few investors or market pundits are likely to be following the latter course, but what – if anything – does the first half performance suggest we can expect going forward and can we usefully look to use recent (annualised) performances as a credible guide to the outlook for the second half?
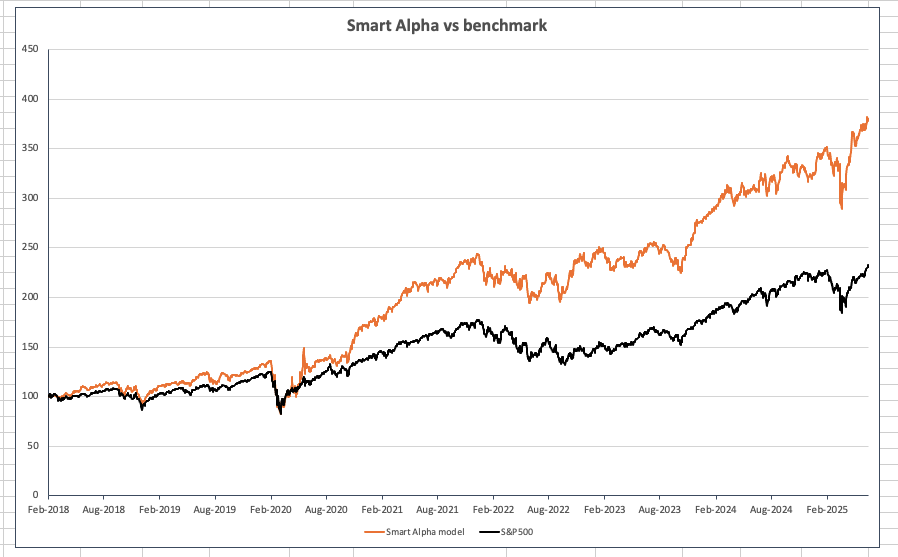
A quick look at the S&P 500 (blue line) on Chart 1 helps to give context to those who are looking at forming a longer-term view of the market. The chart captures the underlying trends of both the S&P500 Index and the Libra Smart Alpha model portfolio for large Cap US stocks (of which more later) but beyond the obvious steeper slope of the Orange (Smart Alpha) line, the chart doesn’t really capture the degree of implied return growth over time. If we revisit the idea of annualization of returns to provide a proxy kind of yield, one way we can show what sort of level the annualised return should try and emulate is to plot a lagged, rolling two-month period, annualised return of an index/strategy and then trace out the underlying trend associated with it to help frame our expectations. This is shown in Chart 2 for the same two groupings.
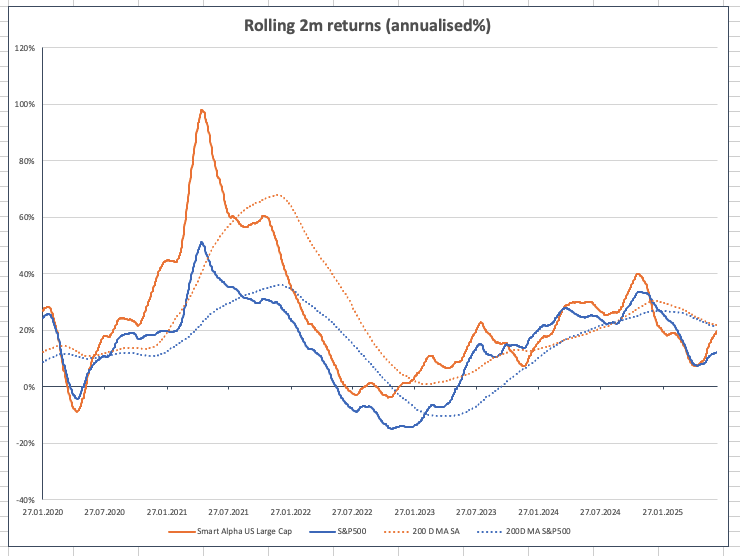
The dotted lines plot the long-term averages of the rolling annualised return time series data, and whilst both the S&P500 and the Apollo Smart Alpha strategy are currently showing that trend level at around 21%, their historic patterns are notably different. The significantly negative performance in 2022 in particular, is clear to see for the S&P500, with the Smart Alpha strategy barely in negative territory (and not negative at all from this longer-term trend perspective). For the S&P, it seems less credible that the current underlying level of trend annualised return is going to remain close to current levels as the relatively poor overall performance in all but the last few days of H1 begin to drag the trend lower. By contrast, the 18.5% YTD return and 23% 12-month return for the Apollo portfolio is certainly more in line with the implied trend expectations shown here, and although we are not about to annualise the shorter term returns for either basket, we see little reason to question that the current annualised trend returns for the Smart Alpha portfolio are not achievable.
This chart also helps to explain why both the outcomes and the prospects for the two baskets look as different as they now do. When combined with the clearly very different long-term outcomes in terms of compound returns over time as shown in Chart 1, it suggests that the focus of portfolio construction and risk management for the Smart Alpha portfolio would appear to be to maximise this measure of trend return: Spoiler Alert: this is precisely what it does. Through a systematic, risk-adjusted return stock selection approach and a range of stock level and factor level risk mitigation measures, the focus upon compound, trend returns using a rolling two-month investment time frame is central to the Apollo process. We can then use a sliding scale of risk hedging at the portfolio level and reduce overall portfolio (and trend) volatility against a range of investor risk appetites. The fact that Smart Alpha is able to do the former (by default) and allow the latter (by design) is because we treat stock selection, portfolio construction and risk management as a fully integrated process.
Unknown Knowns
Most people are familiar with the 2002 framing of information by the then US Defence Secretary Donald Rumsfeld into the categories of Known Knowns – things we know we know and understand, Known Unknowns – things we know exist but don’t have full knowledge of, and Unknown Unknowns – things that we don’t know that we don’t know. However, there is a fourth category – the Unknown Knowns. These are things that we do know (or are known by others) but either choose to ignore or deny to ourselves. And in decision making, these are the most important information things of all.
Having rejected the idea that all risk is unavoidable – there are plenty of risks that as investors we actually do not need to take – we focus upon how to best manage those elements of uncertainty and exposure related to the portfolio construction process that are unavoidable in order to at least manage and mitigate their impacts. What the Smart Alpha model does in its portfolio construction is to address these Unknown Knowns directly. In the example that follows, the Unknown Known is the tail risk due to a sell-off such as we witnessed in April 2025.
The charts and tables below show one way in which the Libra Smart Alpha product is able to provide this kind of management of uncertainty and tail risk. Starting with a pure equity long-only portfolio selected from the point-in-time constituent members of the S&P 500 index and following the Libra Smart Alpha methodology, we are not concerned with the external (avoidable) risks of adding non-equity factor risk in terms of a multi-factor portfolio approach. Meanwhile, the use of the S&P500 as a selectable universe means that there are no additional risks taken with regard to liquidity, transparency, benchmarking or complexity. The only thing we need to manage and mitigate are the uncertainties contained in the portfolio process itself.
We do this as follows:
- Concentration risk is managed via stock level diversification holding 48 equal-weighted stocks.
- Autocorrelation and information change (news) is managed via a rebalance every two months.
- Factor exposures are rebalanced to be factor neutral (Deep Value, Value, Quality and Growth) every two months to mitigate against any emerging Factor bias.
- Tail risk exposure is mitigated via a leveraged hedged position in an ETP net short position in the S&P500 as described in the Building blocks piece.
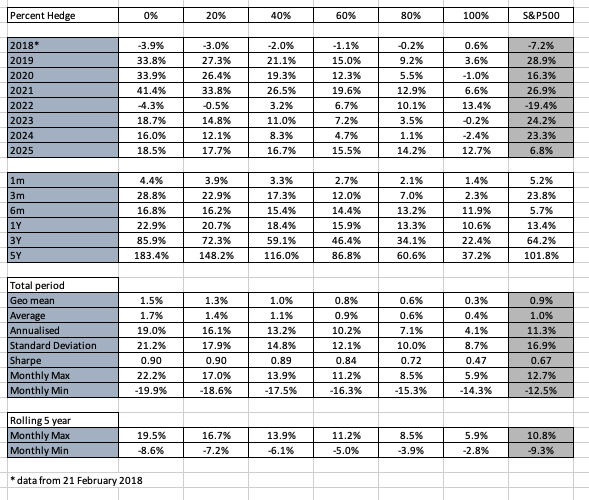
The chart and table show how this last point in particular can be used to adjust the Long- only portfolio to be a tail-risk hedged portfolio (point 4) to varying degrees as outlined in our recent Building blocks commentary. The period concerned is from February 2018 to 4 July 2025 and the data in the accompanying tables reflect the returns across the entire period. This, of course includes the COVID period that has now dropped out of the % year relative data set, so the last two rows of max/min numbers that are included refer to the last 5 years only
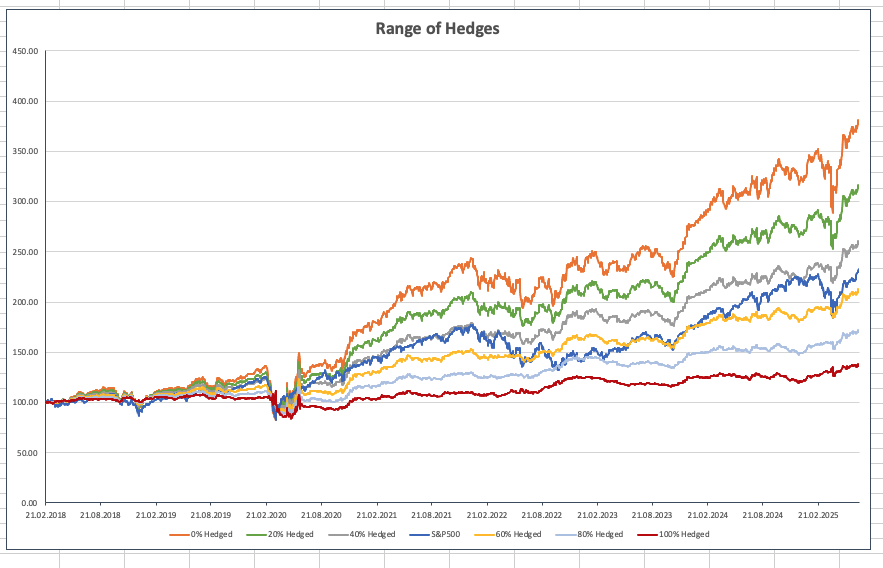
Chart 3 shows how a range of potential portfolio NAVs can be extended from the single (orange line) in Chart 1 to encompass this tail risk hedging method with varying degrees of Beta hedge – once again as discussed in the Building blocks piece. The performance results from this are shown in the accompanying table alongside the S&P500 index for comparison
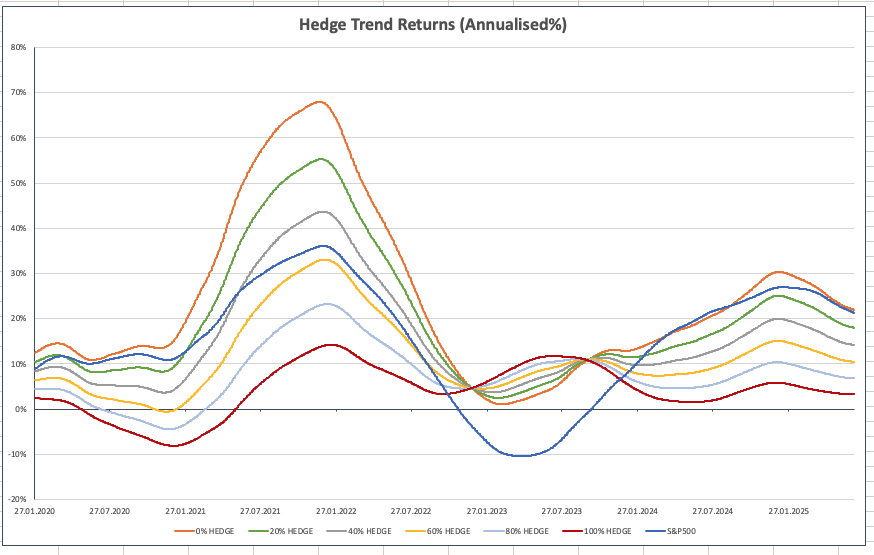
Finally, Chart 4 repeats the trend returns example shown in Chart 2 for the whole range of hedge strategies (the dotted lines in Chart 2 are shown here as the solid orange and blue lines). The lower level of variance of the underlying trend expected returns is consistent with the annualised volatility and returns data shown in the tables with only the 0% and 20% hedged portfolios having higher trend volatility (but significantly higher returns) than the S&P500. Note that both the 100% hedge and 80% hedge trends show a dip into negative territory during 2020/2021. This is likely caused by the extreme movements and high levels of daily volatility in the COVID period highlighting the limitations of using the short S&P500 leveraged ETP based upon only monthly rebalancing of overall net exposure as opposed to a daily rebalance of the hedged exposure.
Conclusions
Investment decisions should be designed to provide systematic, repeatable outcomes with a focus upon compounding returns and maximising wealth over time. They should be the process outcome of the portfolio construction methodology that is followed and the risk matrix that is used in conjunction with it.
There are three steps to this.
- Reject all risks that are avoidable. This means that externally determined risks (liquidity, transparency, complexity etc.) and including multi asset risk exposure can simply be removed from the investment decision and the potential universe of investible assets identified.
- Construct a portfolio from that universe utilising the highest level of information available to narrow down and select assets that are designed to work at a portfolio level to explicitly compound wealth over time. This means that expected returns are not the optimal selection process but that the uncertainty relating to those returns is an explicit part of the selection decision. This includes a deliberate decision to use investment Factors as a categorisation process; making sure that no unintended factor Bias exists as part of the selection process.
- Structure the Equity portfolio in such a way as to ensure that tail risk can be actively hedged. Rather than relying on the supposed non-correlation of bonds to equities to manage and mitigate against this, the best way to hedge the risk of a negative market event is to be “short” the beta of the market itself via a short position in the S&P500. The degree to which the hedge exists can be approximated as the hedge percentages in the table, so the default “60/40” portfolio of Investment Management is the 40% hedged portfolio column, whilst a more aggressive “80/20” is captured by the 20% hedged portfolio column and so on. What we referred to as the “pure Alpha portfolio in the Building blocks piece is the 100% hedged column.
By investing in a single, properly specified Long-only Large Cap Equity Multifactor portfolio, the simple adjustment of the hedge parameter, allows that portfolio to be adjusted dynamically to map to the changing level of a client’s risk aversion over time and to ensure that their client’s goal of Wealth Maximisation is achieved at the lowest level of risk possible.