
How Apollo signals can help to gauge the market.
As a first blogpost, it seemed timely to showcase how some of the Apollo signals and indicators can inform us about the prospects for the US market over the next twelve months.
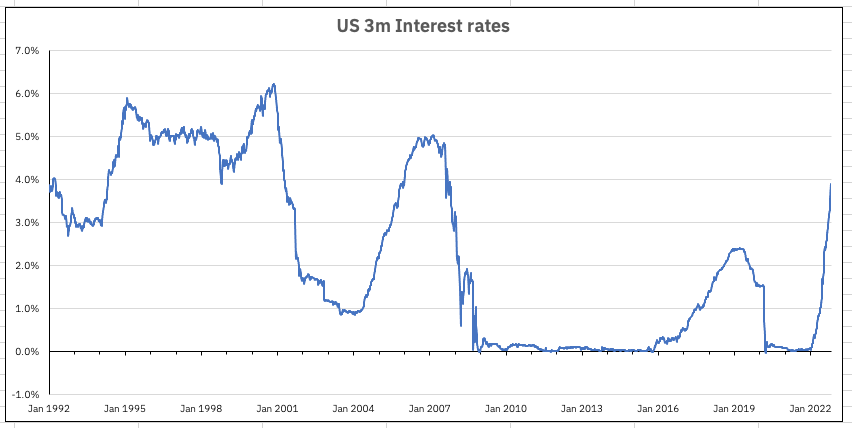
The SP500 is down 19% since the start of the year (at time of writing) as the shift in the economic and geopolitical situation has seen a widescale de-rating of the US equity market. The dominating factor is, of course, the tightening in US monetary conditions, as the US Federal Reserve brought the era of ZIRP to an end with a near-unprecedented rise in interest rates through the course of the year. Back at the start of 2022, the US 3-month Treasury bill yield was 0.4% – now it is 4.0% as market rates led the Fed higher through the spring and summer. The historical context of just how long interest rates in the US remained depressed (“Taper tantrum” not withstanding) and then how rapidly this recent tightening has occurred, is illustrated in the first chart below:
Chart 1: US 3-month Treasury yield – 1992-2022
The question that now arises is – has the US market corrected far enough in both price and value terms to attract investors? Using Apollo’s market level signals and analytics, we can look at how the three drivers of the market activity – the expected return, the implied cost of capital (ICC) and the level of uncertainty evident in price action – can combine to provide an answer to that question.
“Using Apollo’s market level signals and analytics, we can look at how the three drivers of the market activity – the expected return, the implied cost of capital and the level of uncertainty evident in price action – can combine to provide an answer to that question.”
The first factor that we consider is the implied cost of capital – the effective “discount rate” that the market applies to future forecast cashflows – has changed in line with this money market tightening and the economic cycle.
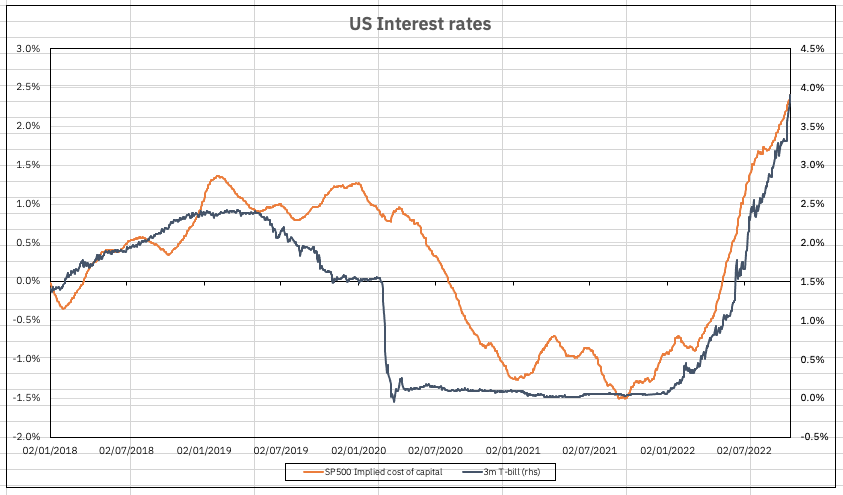
Chart 2: puts the recent interest rate tightening in this context, with the post 2018 3-month Treasury yield shown alongside the Apollo measure of the SP500’s ICC (note the different scales where, for a period from August 2020 to May 2022, the ICC was actually negative – below zero on the chart). We can see that the lows in the ICC occurred in September 2021 and anticipated the money market tightening into year end.
Chart 2: US 3m Treasury yield & SP500 Implied cost of capital 2018-2022
The “derating” of the market that this illustrates is clearly a function of official monetary policy tightening – not least because the “risk free” rate has now turned strongly positive – but it is important to note that the discount rate that the market applies to future cashflows has both an external influence and an internal market dynamic. Confidence in the future cashflows provided by the market drives the cost of capital lower – and vice versa. As inflation picked up and energy costs rose throughout 2022, the Apollo determined Fair Value (FV) of the Market – shown as the orange line on Chart 3: – peaked in late January and is now some 12% below that peak but now stabilising.
Chart 3: SP500 risk regimes 2018-2022
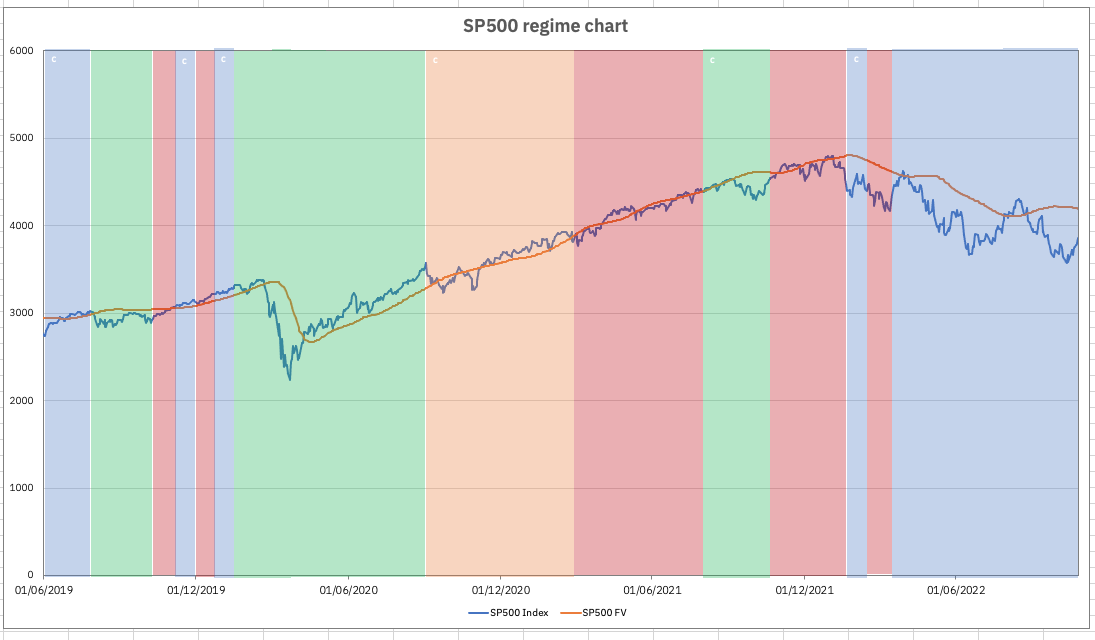
One thing that we are able to do with the combination of the ICC and the trend in FV data is transform this data into a risk regime signal; indicating when the market is in a value (blue), expansion (re-rating) growth (green) late-stage growth (yellow) or contraction (de-rating) mode (red). This is shown for the SP500 on Chart 3:
This confirms that, by mid-March 2022 the 12.5% decline in the market since the start of the year had taken the SP500 back into value territory. However, with the FV trend of the market in decline, this has also led to a reassessment of the expected return for the market. Simply put – if the Fair Value of the market (in the form of the future payoff for holding the market) is deteriorating at the same time as the ICC is rising, then even if the market is showing itself to be in a Value regime, the risk-reward trade off needs to be revised.
This process is clearly illustrated using the Apollo 12 month expected return forecast chart below:
“…if the Fair Value of the market is deteriorating at the same time as the Implied Cost of Capital is rising, then even if the market is showing itself to be in a Value regime, the risk-reward trade off needs to be revised.”
This process is clearly illustrated using the Apollo 12 month expected return forecast chart below:
Chart 4: SP500 12m Target expected return ranges
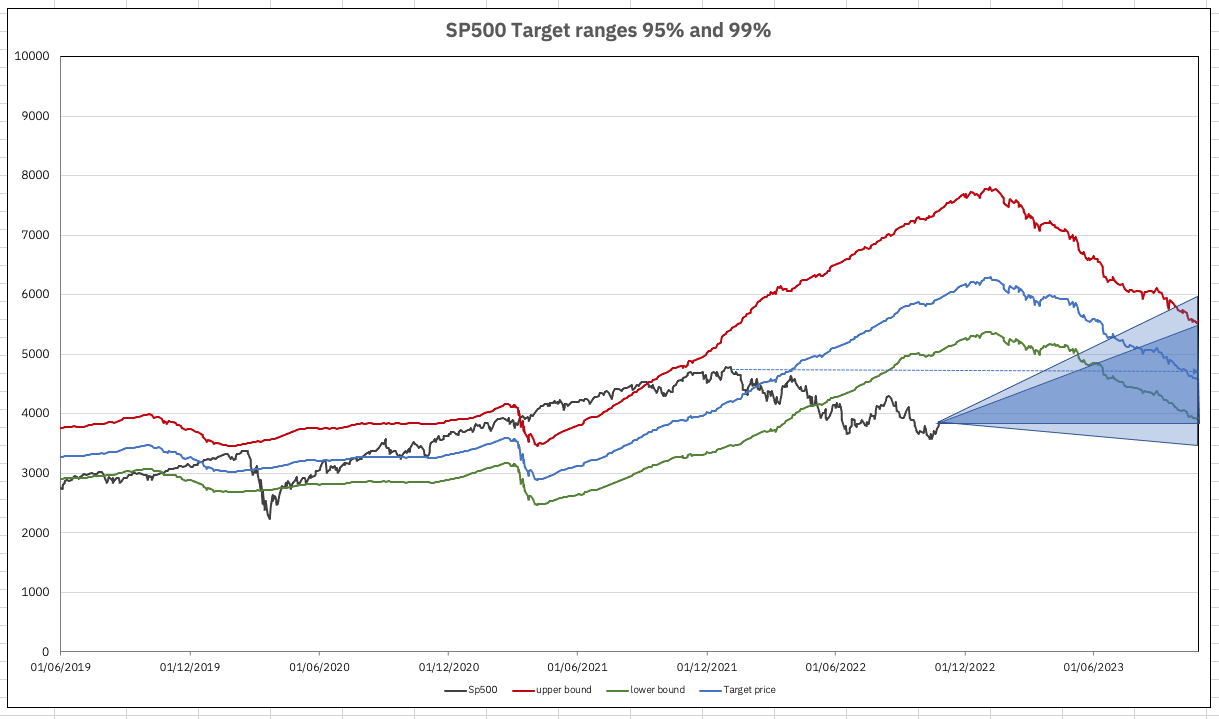
The Apollo asset pricing model generates a systematic expected return forecast for over 8000 stocks worldwide and, by nature of its forecast risk and return methodology, is also able to translate this to the index level. This chart shows both the central 12m target price forecast (blue) and its probability density function – the green and red lines and the inner triangle marking the 95th percentile range for October 2023 and the 99th percentile for the latest forecast extended to the outer triangle.
The peak 12m forward target price shown on the chart was from 3 January 2022 – a 12m target price of 6303 and forecast return of 38% for January 2023. This also coincided with the lows in terms of US short term rates shown on Charts 1 and 2. The deterioration in forward prospects for the market clearly tracks the pattern of Fed tightening (and the short-term interest rate mirroring this). The shift in expectations from early May – when the market broke down through the forecast-implied lower bound from 12 months earlier. The real decline in expectations, however, corresponds to the early June tightening by the Fed and we can see that not only does the market remain at levels well below the forecast lower boundary from 12 months previously but the whole forward forecast range is now significantly lower – with a 12-month central forecast level of 4608 – lower than the peak level seen for the market in January 2022.
“…the whole forward forecast range is now significantly lower – with a 12-month central forecast of 4608 – lower than the peak level seen for the market in January 2022.”
For reference, the 95th Percentile Apollo index forecast range for October 2023 is 3934 – 5534 which, set against the current SP500 index level of 3859, suggests that forecast risk is now fully priced in.
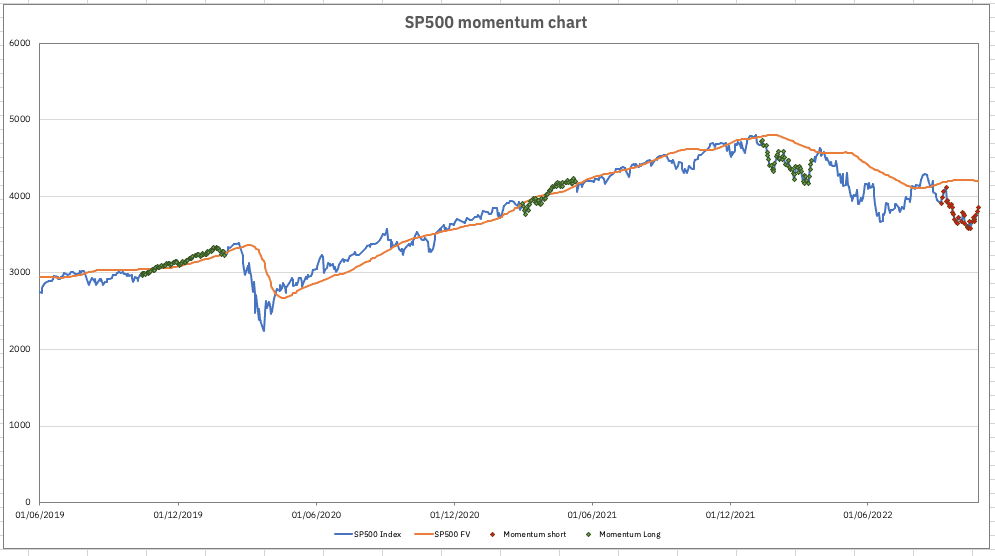
The final chart is one that shows the fundamental momentum of the “forecast payoff” for the market – the momentum of expected return. When the market is seeing significant positive momentum with regard to expected returns, the green flags are shown and red when momentum is in reverse. Chart 5: shows that the SP500 is still showing significant negative momentum in this regard.
Chart 5: SP500 Momentum chart

Conclusions
Apollo is able to show that although the SP500 is still showing negative momentum with regard to future expected return momentum, with the market now a value market and with forecast risk fully priced in, the market may not need much in the way of positive news going forward to start to reverse this situation. As the earnings season continues to unfold (recent “mega-tech” disappointments not withstanding) and the tax loss selling amongst mutual funds starts to abate, it is easy to see how the idea of a November “melt-up” could come to pass.