
A recent article on Trustnet caught my eye. Titled “The most consistent global funds over the past decade” the focus was on consistency – how consistency as opposed to occasional outperformance is what investors seek but that only a handful of funds have been able to deliver it. As a long-standing advocate for not focusing or obsessing over single period returns this looked worth reviewing.
The report focused on the IA Global sector which consists of over 550 funds that invest at least 80% of their assets globally in equities, focusing on capital growth. Perhaps surprisingly, of these, only six funds beat the index in at least 7 of the last ten years – all six being in the first quartile for returns – ahead of the sector average total period return of 175% and the MSCI World benchmark return of 246%. For only 1% of the IA Global Sector to achieve this degree of consistency certainly gives pause for thought. All credit to those managers in this august grouping (whose funds have rightly benefitted from positive inflows as a consequence) but perhaps this helps to explain the lack of appetite for other “active managers” if their performances are too inconsistent to be able to deliver. On that point, the passive consistency of L&G’s Global 100 was also recognised as one of two trackers that outperformed the benchmark consistently over the last ten years (the other fund mentioned being the HSBC MSCI World UCITS fund).
How do we stack up?
The other point of interest is, of course one of potential peer review. The Libra Smart Alpha Global strategies are designed to provide systematic long only and, now long/short investment strategies for global equities and this seemed to provide a quick reference “ready reckoner” for positioning their relative performances. If anyone wants to get a sense of how good or bad a strategy is, then this kind of long-term analysis could prove useful.
The peer comparison is straightforward. The Smart Alpha benchmark (and investible universe) is the S&P1200 – not the MSCI World. In truth there is not a huge difference between the two, but the MSCI benchmark is Mid/Large Cap whilst the S&P1200 is large cap only. The challenge is to be able to say that Smart Alpha can be added to this cohort (spoiler alert : it can!)
The report concentrated on returns based in GBp as opposed to US$ so I converted the returns for the Smart Alpha strategies from US$ to Sterling using year end FX rates and the total return NAV for each strategy (calculated independently by IndexOne). The systematic backtests that we run on the Smart Alpha strategies start in June 2016, so whilst the 2016 data is shown in the table is only from June 22, 2016, this still catches the big FX change in 2016 in favour of the US$. However, for the Chart the like-for-like comparisons are only shown from a start point of January 1 2017.
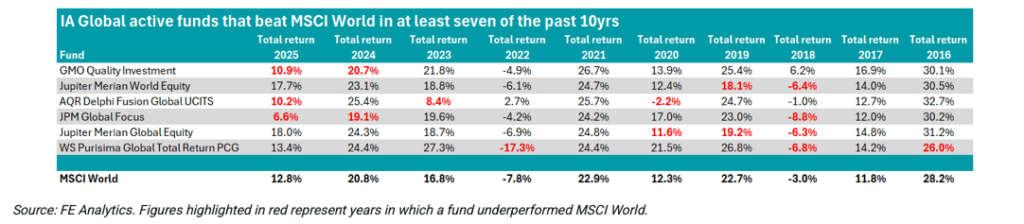
The table in the Trustnet report shows the calendar year total return performances of these top funds over the last decade against the MSCI benchmark. Those periods that underperformed the benchmark are displayed in red text. I have repeated this as Table 1 below:
Table 1: Trustnet report table
I have taken this framework and added in the two passive funds and two Smart Alpha strategies – the Global Long Only and the Global Long short for comparison. I have also added the total returns for the S&P1200 for reference. The periods where the funds underperform this benchmark are in yellow boxes (so a year where a fund is underperforming both the MSCI and the SP1200 would be a red number in a yellow box).
Table 2: Augmented report table
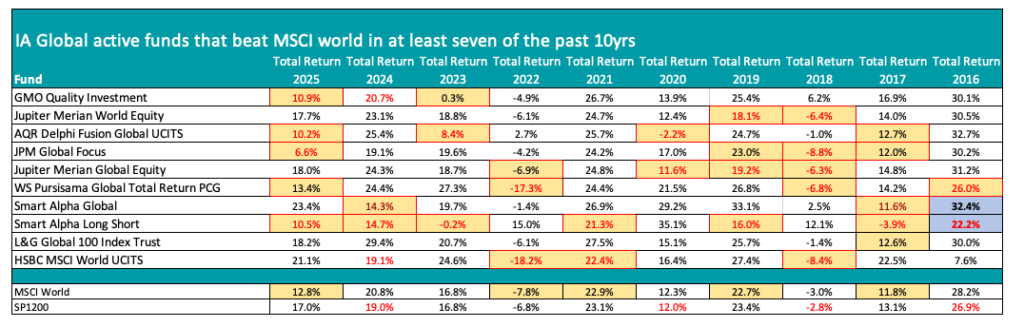
A few key points stand out here. Firstly, the Smart Alpha Global Long only fund had the same degree of consistency as the top six (noting that the 2016 return is for the second half only) and that in 2017 this was only an underperformance of 0.2% versus the benchmark. The strategy made the cut for the 1% club on this basis. Secondly, that the Long only portfolio did the opposite – it underperformed the benchmark in 7 out of ten years. However, in the years that counted – 2018, 2020 and 2022 – it outperformed strongly. A strongly non correlating strategy in other words.
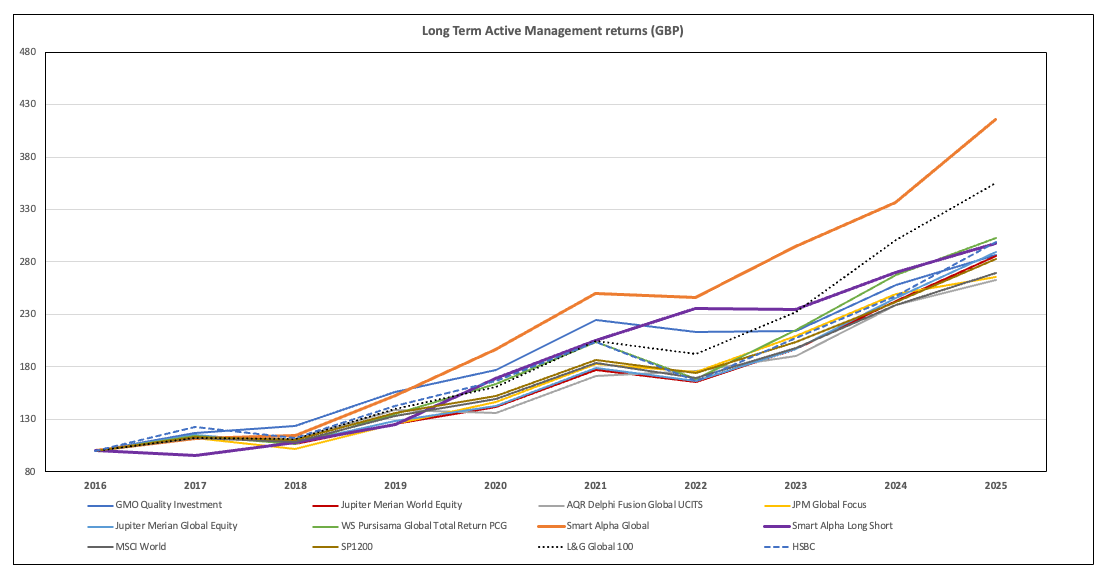
It becomes even more interesting when this is translated into a visual showing compounding returns over the long term. Chart: 1 (below) has created a simplified Annual NAV for each of the funds shown in Table 2 with January 2017 set to 100. The two passive funds are shown as dotted lines.
Chart 1: Long term compound NAV (GBp)

Suddenly the Smart Alpha strategy(orange line) is not only amongst the top six – it is significantly outperforming all of them. Even more interesting is how the Smart Alpha Long Short fund is in third place only being beaten by to the compounding L&G long only benchmark and the Smart Alpha long only strategy. The non-correlation of the Long/short strategy is clearly visible against the L&G tracker and especially over the 2022-2024 period against the majority of funds.
Of course, this is just a back tested model with no transaction costs or fees attached but it does suggest that we must be doing something consistently right through time.