

Storm Systems Developing

We call our regular Apollo based commentary “The Weather report”. The analogies that we can make with the multiple elements of Value, Momentum and Uncertainty impacting markets in a continuous way chimes nicely with the idea of Currents, Tides and Winds, all impacting the navigation of the high seas. Whatever the nature of the vessel concerned or the skills, experience and capabilities of the crew, the Maritime Weather Report is an essential part of the information system that is required and so the Market Weather Report is designed to perform a similar, essential function.
We end the first quarter in a completely different place to where we started it. The expectations and seemingly near certainties of January – rotation towards real assets and companies with defendable cash flows, a healthy scepticism towards some of AI’s (over) promises, diversification away from over concentration on the US in general – and on Tech in particular -came up against the reality of war in the Middle East. These general realigning trends may well prove correct over the course of the coming months, but there is little doubt that, inside a month, market sentiment has flipped. Latent uncertainties have become recognisable risks. Timeframes have collapsed and promises of exponential revenue growth by 2030 have been replaced by what-if scenarios for collapsing economic activity, rising inflation, and higher interest rates. For postponed investment plans, refunding prospects, and widening credit spreads.
To (re)use an analogy we have articulated previously, “the cockpit has gone dark”. Information quality is at a premium and we are flying somewhat blind; relying more on instinct and experience than the inbuilt navigation systems of our existing investment processes that we (probably rightly) fear are overly prone to ‘hallucination’ right now. Everything has become correlated to everything else. What happens next month is as likely to be a function of what happens in three days’ time – or three weeks’ time – as it is a function of what happened last month or last year.
As investors once again lose sight of their familiar information set of quarterly earnings reports, analyst updates and corporate guidance, a robust process for stock selection and risk management becomes business critical. We really are “forecasting under uncertainty” now, although one could argue that the reality is less about uncertainty than (un)predictability (more of which later). In these markets, doing nothing is not an option but the confidence one has in the required decision-making process now requires a degree of quantification normally considered a luxury – not an essential. Understanding that the core component of investment-decision making – the ability to forecast risk-adjusted expected returns – is not simply an iterative extension of past realities but a dynamic reflection of changing news flow and implied shifts in future prospects and risks at the corporate level is key.
As we noted last month, “…Old alignments of risk and reward may shift marginally – or massively. We cannot tell for now. Will Oil and Natural Gas prices remain elevated even though a lot of the technical positioning in the markets were already set for a directional move higher? Does the immediate aftermath of the Ukraine Crisis in February 2022 give sight to the risks to global energy, foodstuffs and fertiliser supply chains for the wider world that are already the “certain” first round effects of events in the Middle East? Will the stresses already existing in the Private Credit markets lead to a crisis as global liquidity demands undergo a step change? Will Middle Eastern capital flows destabilise the flows in Global Real Estate activity or in raw commodity (and their derivative) markets and what does that imply for the response from Central Banks, Sovereign Wealth Funds, or mobile global wealth?”
We went on to discuss the fact that the Apollo System is well suited to such a task, whilst emphasising the fact that we are currently ”…in the low confidence low-predictability phase of things”. A month on and not much appears to have changed on that front, but it is still useful to take a look at the performances of the markets through our familiar Apollo lens since the start of March and over the quarter as a whole.
Review of Performance – under the surface
In taking our normal look at some of the recent performances of the main market indices through the lens of the Apollo strategy models (price performances are to index close values from 31 March 2026) we can try and build upon our first, tentative thoughts of a month ago. The last day of March was actually one of the stronger, positive performances of recent months – perhaps in part due to month-end and quarter-end position squaring and de-risking taking place.
The 6-month returns in Table 1 take us back to the end of Q3 2025 whilst the 3-month number taking us back to the start of the quarter and, indeed the year year. Given the turbulent nature of recent events we have added in the 1-month return numbers to table 1 (below)
Table 1: Performance Report (price returns %)
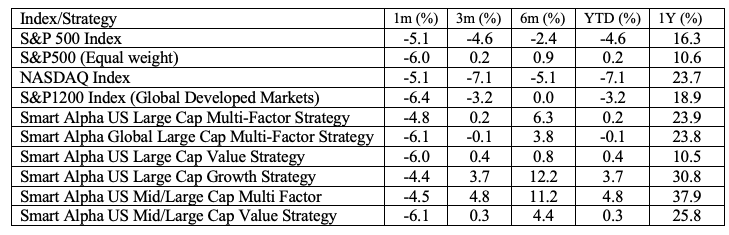
Monthly performances were arguably a little flattered by the last-minute rallies that left most markets down by 5-6% on the month as opposed to 8-9% (in price terms) but it is the YTD figures that reveal where the positional pain is now being felt. The S&P500 is now down (-4.6%) in price terms (-4.4%) total return. Meanwhile the S&P Global 1200 is down -3.2% and the Nasdaq is down -7.1%. Q2 2005 told us a fall of that scale takes a lot to recover from to just get back to break even and it is far from clear that we are at any kind of inflection point as yet.
Alongside these we can see the selection of Smart Alpha strategies that we run (and publish – see https://www.libra-is.com/strategies ) are reflected here and we categorise all the stocks under coverage by “style factor” based upon our own, fundamentally derived classifications (Value, Growth, Quality, Junk etc.) using the Apollo model for expected returns. These have fared significantly better – The Global 1200 Multifactor strategy is flat on the year, whilst the US Large Cap Multifactor (+0.2%) in price terms. In fact all of our US related strategies continue to show a positive YTD return (both total return and price return).
Risk (and returns) by Factor
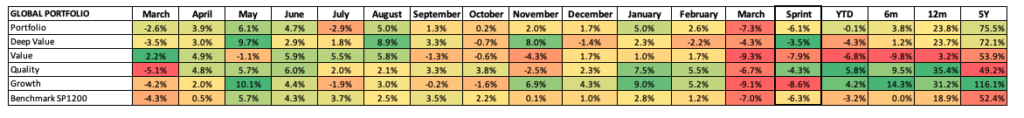
In terms of the sector drivers that we can see in Table 2, the differentiated drivers of the Global Multi–factor portfolio from the sub-portfolios YTD has been from Quality (+5.8%) and Growth (+4.2%) but Deep Value (-4.3%) and Value (-6.8%) have been consistently negative. Clearly the month of March has been negative across-the-board (the impact of the price moves over the weekend of 28th February when conflict started clearly change the baseline calculations for the month compared to most other months) but the Sprint to date performances are also revealing. The Sprint rebalance was on February 18th and since then it has been essentially in line with the broader index. However, it is both Value and Growth that have taken a hit when compared to Quality and Deep Value. This suggests that a broad level of de-risking is taking place and that the factor groupings where risk premiums are either already very high (deep value) or where visibility is highest ( Quality) are looking more defensive than those where more intangible revenues are now being more heavily risk priced (Growth and Value).
Table 2: Global Factors
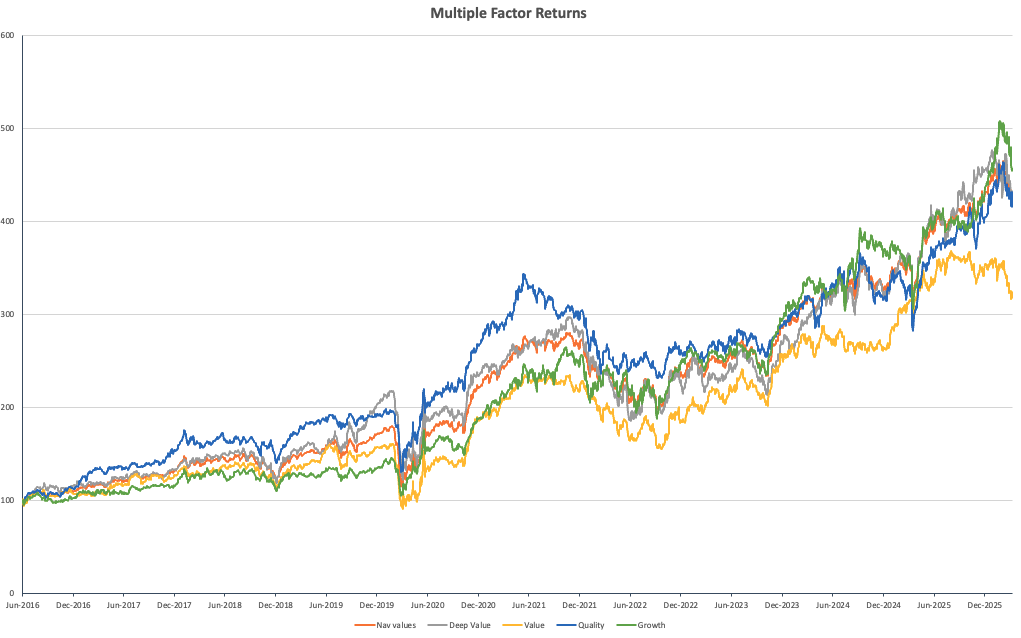
This is reinforced by observing the longer-term compounding portfolio and sub portfolio NAV chart shown in Chart 1. Quality (blue) remains aligned with both the total portfolio (orange) and clearly ahead of value (yellow) over the total period with Growth a clear compounding winner over longer horizons before succumbing to the reality check of the last six weeks. The sharp drop off in the relative performance of Value over the last few weeks can be seen against a broader, negative value environment of the last eighteen months.
Chart 1: Compounding returns
Weather Forecast – everyone has a view – just not a very long-term one
The degree of conditionality over “what happens next” in terms of markets is so clearly aligned to “what happens next” in the conflict in the Middle East that we find ourselves in the mindset of day traders prepositioning on US Non-farm payroll figures or, more significantly perhaps, the Polymarket betting on the missing Titan sub in 2023 that (arguably) gave rise to a new form of both decentralised, collective identification and subsequent validation of event outcomes. A (decentralised) identification of a potential event leads to a “crowdsourced bet” which is then is priced and traded as investors “…put their money where their mouth is”. A final “pay-out” may never even occur as the “in-game” betting moves onto another event story.
So with the financial markets. Assessing the predictability of outcomes is effectively becoming a “shell game” of moving parts – what is the most significant news story one day may be displaced by something completely new the next. In following a Polymarket-style event-based trading model (let’s call it the “poly-model”), liquid global capital has been seeking to take a middle-ground role between speculation and investment. The pricing is not of the “event” per se but its’ possible impact on existing asset prices whose predictability premium becomes the trade.
When combined with the rapid evolution of the Polymarket model amongst retail investors, events of the last year or so seem to have accelerated the adoption of this “poly-model” towards something approaching a mainstream approach. The result of this is that commitment to opinions is becoming ever more ephemeral: the dominating concerns of week one look quite different to those of week five. Integrating externalities into the opinion chamber means that when headlines talking up concerns over private credit risks or question marks over AI revenues combine with suggestions that US Tech company operations in the Middle East may be targeted by Iranian a whole new shell game is kicked off. Forget the Mag-7 concentration risk story – replace it with the global chip supply crisis or the helium gas dilemmas. Trade US tech one day on the same story as high- risk credit the next. The “most important thing” on Monday has already been forgotten by Friday. Only to re-emerge as the same “most important thing” a week later.
Frankly, it is all a bit exhausting. Step back a little though, and the signals are still detectable through the noise.
Chart 2: The S&P bellwether
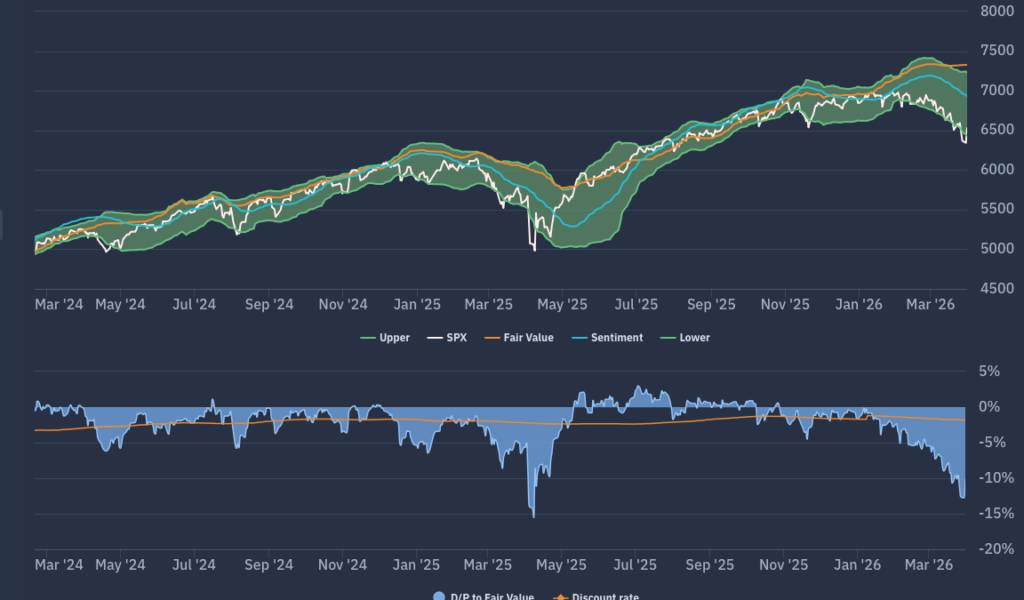
If we take a look at the Apollo market chart for the (market Cap weighted) S&P500 shown in chart 2 we see a market that, despite steady growth expectations (the orange fair value line) has seen sentiment (the blue line) turn lower and the price index sink to the declining bottom edge of the FV range. The width of the FV range had already started to widen even before the end of February as it seemed the markets were not buying the “everything is fine” story. With the market level Discount to FV back to the levels of April 2025 but showing no real signs of retreat, we are very much in risk management and risk avoidance territory now.
Moving down a level, we can look at the sector level dynamics now emerging in Chart 3. This is the Apollo beta heatmap for the S&P500 that shows the relative sector rankings in terms of rolling 1-month returns across the main US S&P500 market sectors, ranked by relative market beta from high beta (cyclical sectors) down to low Beta (defensive sectors).
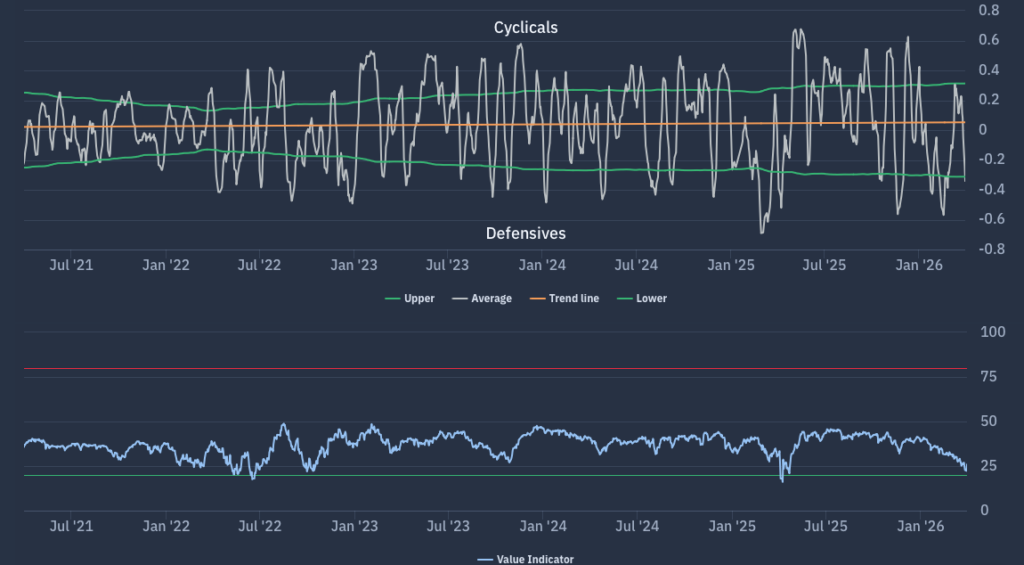
It is no surprise to see the unequivocally positive performance across the Energy sector, with Utilities also gaining positive support. The negative trend of higher beta cyclicals that we observed last month has continued but concerns over second order impacts on Industrials have clearly increased as those over financials have eased. We noted last month that the broadly “net beta neutral” calendar year start had already shifted to a strongly risk averse position as illustrated by our Net beta chart (Chart 4) (the net exposure bias between defensives and cyclicals) and even though it has see-sawed throughout March we remain close to those previous lows.
Chart 3: Apollo S&P500 Sector Heatmap
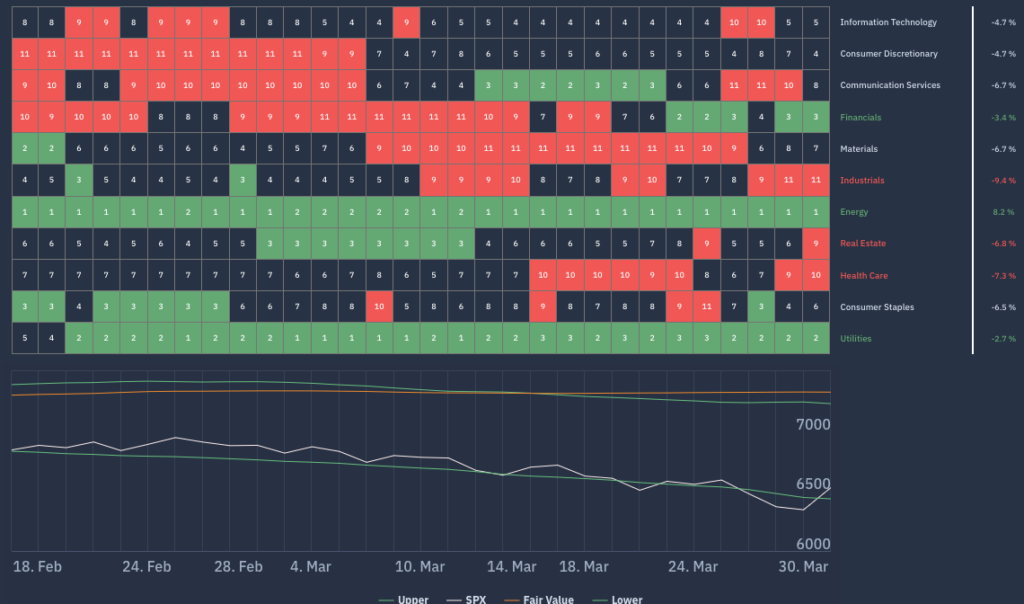
Chart 4: Apollo S&P500 Net Beta Chart
Forecasts and conclusions
The last month has seen a shift from ongoing rotations based on a re-evaluation of relative longer term investment opportunities to a far shorter-term, active risk management mindset. Here too, there are problems. Classic factor diversification (Value-versus-Growth) is not proving of much benefit from a portfolio management perspective and against a generally deteriorating market outlook, stock specific risks are generally all correlating with the market trend. Even energy – the current “winner” from global events is now a risk factor to manage in the face of the day-to-day news flow and Prediction market mindset that has now taken hold of asset prices.
Like it or not, even if the current storm does come to an end, the “Weather Systems” we are currently facing are not going to abate anytime soon. The complex, chaotic system that we discussed last month is now moving into the emergent phase: new risks and opportunities that were considered possible – dependent on an event – are now risks and opportunities that we are evaluating the likelihood of them actually occurring. The decentralised nature of event-based risk decision-making is seeing the prediction market model of “price as probability” being transferred into existing asset markets in real time. Perhaps the “poly-model” is the emergent investment and risk management model that results from recent events and changes how investment decisions are taken in future. Whether it does or not, recent events have highlighted the need for more formalised, quantifiable and dynamic predictive models for asset pricing.
And finally…
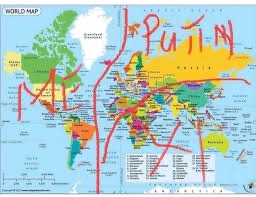
A year ago, we were swamped by the noise and news flow surrounding the US tariff saga as markets looked at the prospects of the global supply chains of the post WW2 era being disrupted by the introduction of global tariffs by the US administration. Talk of US isolationism and the division of the world into zones of influence (the US, Russia, and China) were amusingly illustrated by memes showing crude crayon lines drawn on the Mercator map of the world.
This was compounded by the whole Greenland issue coming to a head at the turn of the year (the US has been talking about the strategic importance of Greenland for some time, but it took President Trump’s somewhat inimical foreign policy approach to formalise it as an issue globally).
In the wake of recent events, talk of US isolationism has died down somewhat and a Supreme Court reversal on Tariffs was an added factor in taking this off of the radar, but following the latest talking points from the US Administration about “Greater North America”, I wonder if this is going to re-emerge as a geopolitical theme as we move towards the US mid-terms.
For those who care about such things, the school wall map (referred to as the Mercator map and used in the “Crayon picture” above) is known to significantly distort relative country and water mass sizes – the further away from the equator, the greater the size of Greenland or Antarctica appears to be. If we use the Authagraph map (below) that is designed to preserve relative sizes and allow the spherical nature of the earth to be captured, then you can see something very interesting starting to emerge.
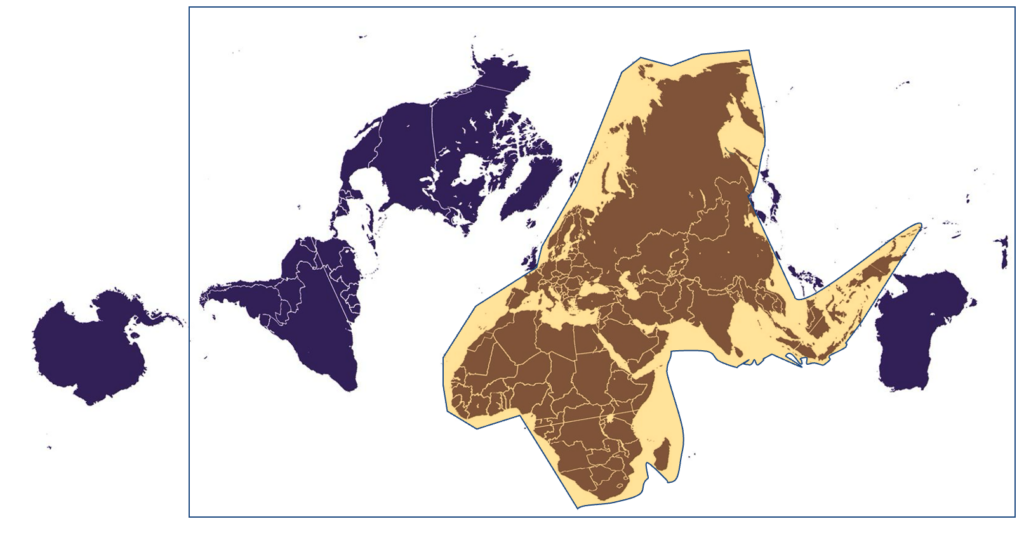
With the “Greater North America” concept in mind, (South America as part of the Greater Americas is likely a work in progress) what we can observe is not an “isolationist America” but an “isolating America” that seeks to ring-fence and isolate those that it doesn’t care to deal with. Not only does the “…we have to have Greenland” barrier make more sense geographically when viewed from this perspective, but with the UK, Japan, Taiwan, South Korea, The Philippines, and Australia as the boundary riders, the shaded yellow block becomes a constrained land mass accounting for about 20% of the earth’s surface. With 80% of the global population inside of it. (I’m ignoring Antarctica on this map as I’m leaving it to the Aliens).
If the US and its allies control the remaining 80% of the world’s surface (the US has long since sought to claim dominion over the Seas) but with only 20% of the world’s population, perhaps the Pareto principle – the 80:20 rule where 80% of outcomes come from 20% of causes – is already being put into action? I wonder what the Polymarket betting odds on that look like?